Crime Data Visualizations
This is an ongoing collection of crime data charts and graphs built for use in criminology and sociology courses. Data sources include the FBI Uniform Crime Report (UCR), Bureau of Justice Statistics (BJS), National Crime Victimization Survey (NCVS), and CDC. Interactive Tableau visualizations can be viewed full-screen using the icon in each embed. All materials are freely available for educational use with attribution.
Click any image to view it full size. Interactive charts link to standalone pages.
Interactive Charts
These standalone interactive charts were built from primary data and include tooltips, filtering, and dynamic views. Opening in the same tab allows full functionality.
Columbus Homicide Data
Interactive chart tracking Columbus, Ohio homicide counts, rates, and population trends over time. Built from primary municipal data.
National Homicide Trends
Interactive visualization of national homicide rate trends drawn from FBI UCR data, with long-run historical perspective.
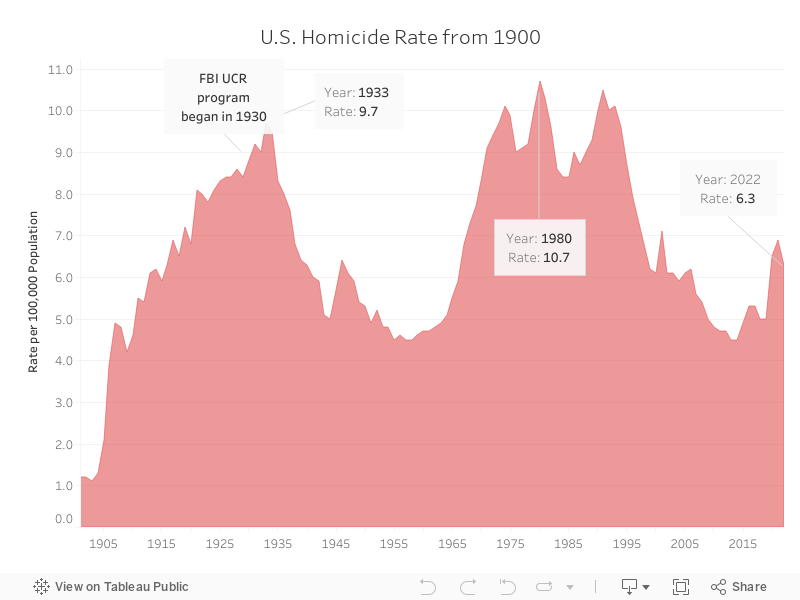
Homicide
The overall U.S. homicide rate has fluctuated significantly over the past 50 years, but is currently much lower than its peak in the 1980s and 1990s. Source: FBI UCR.
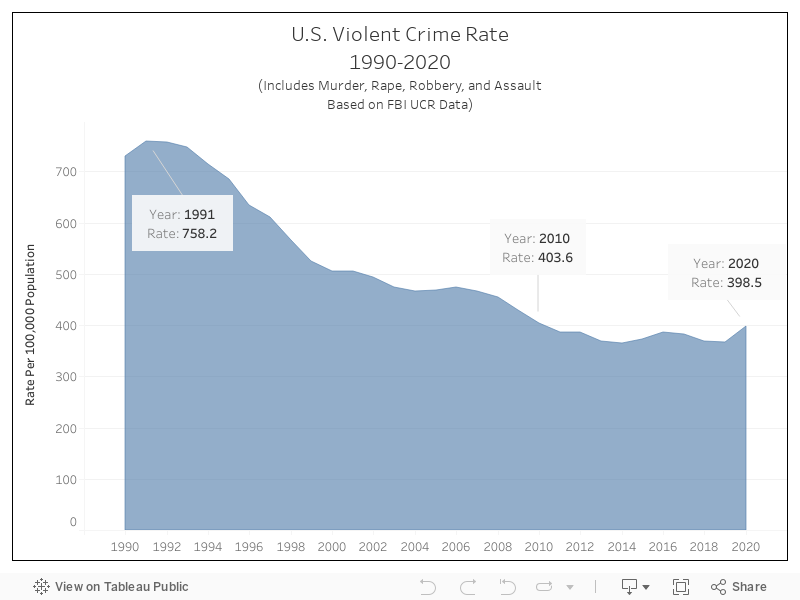
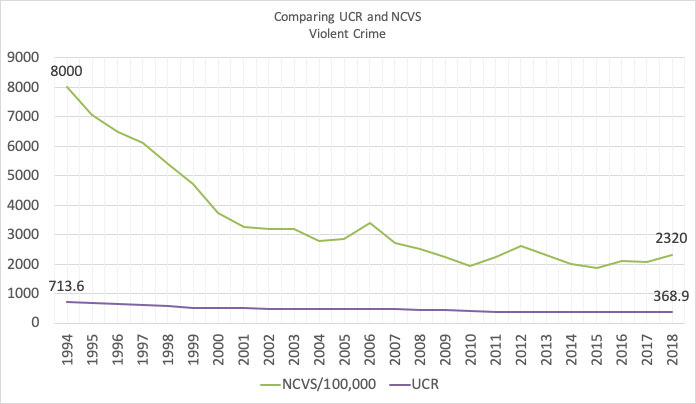
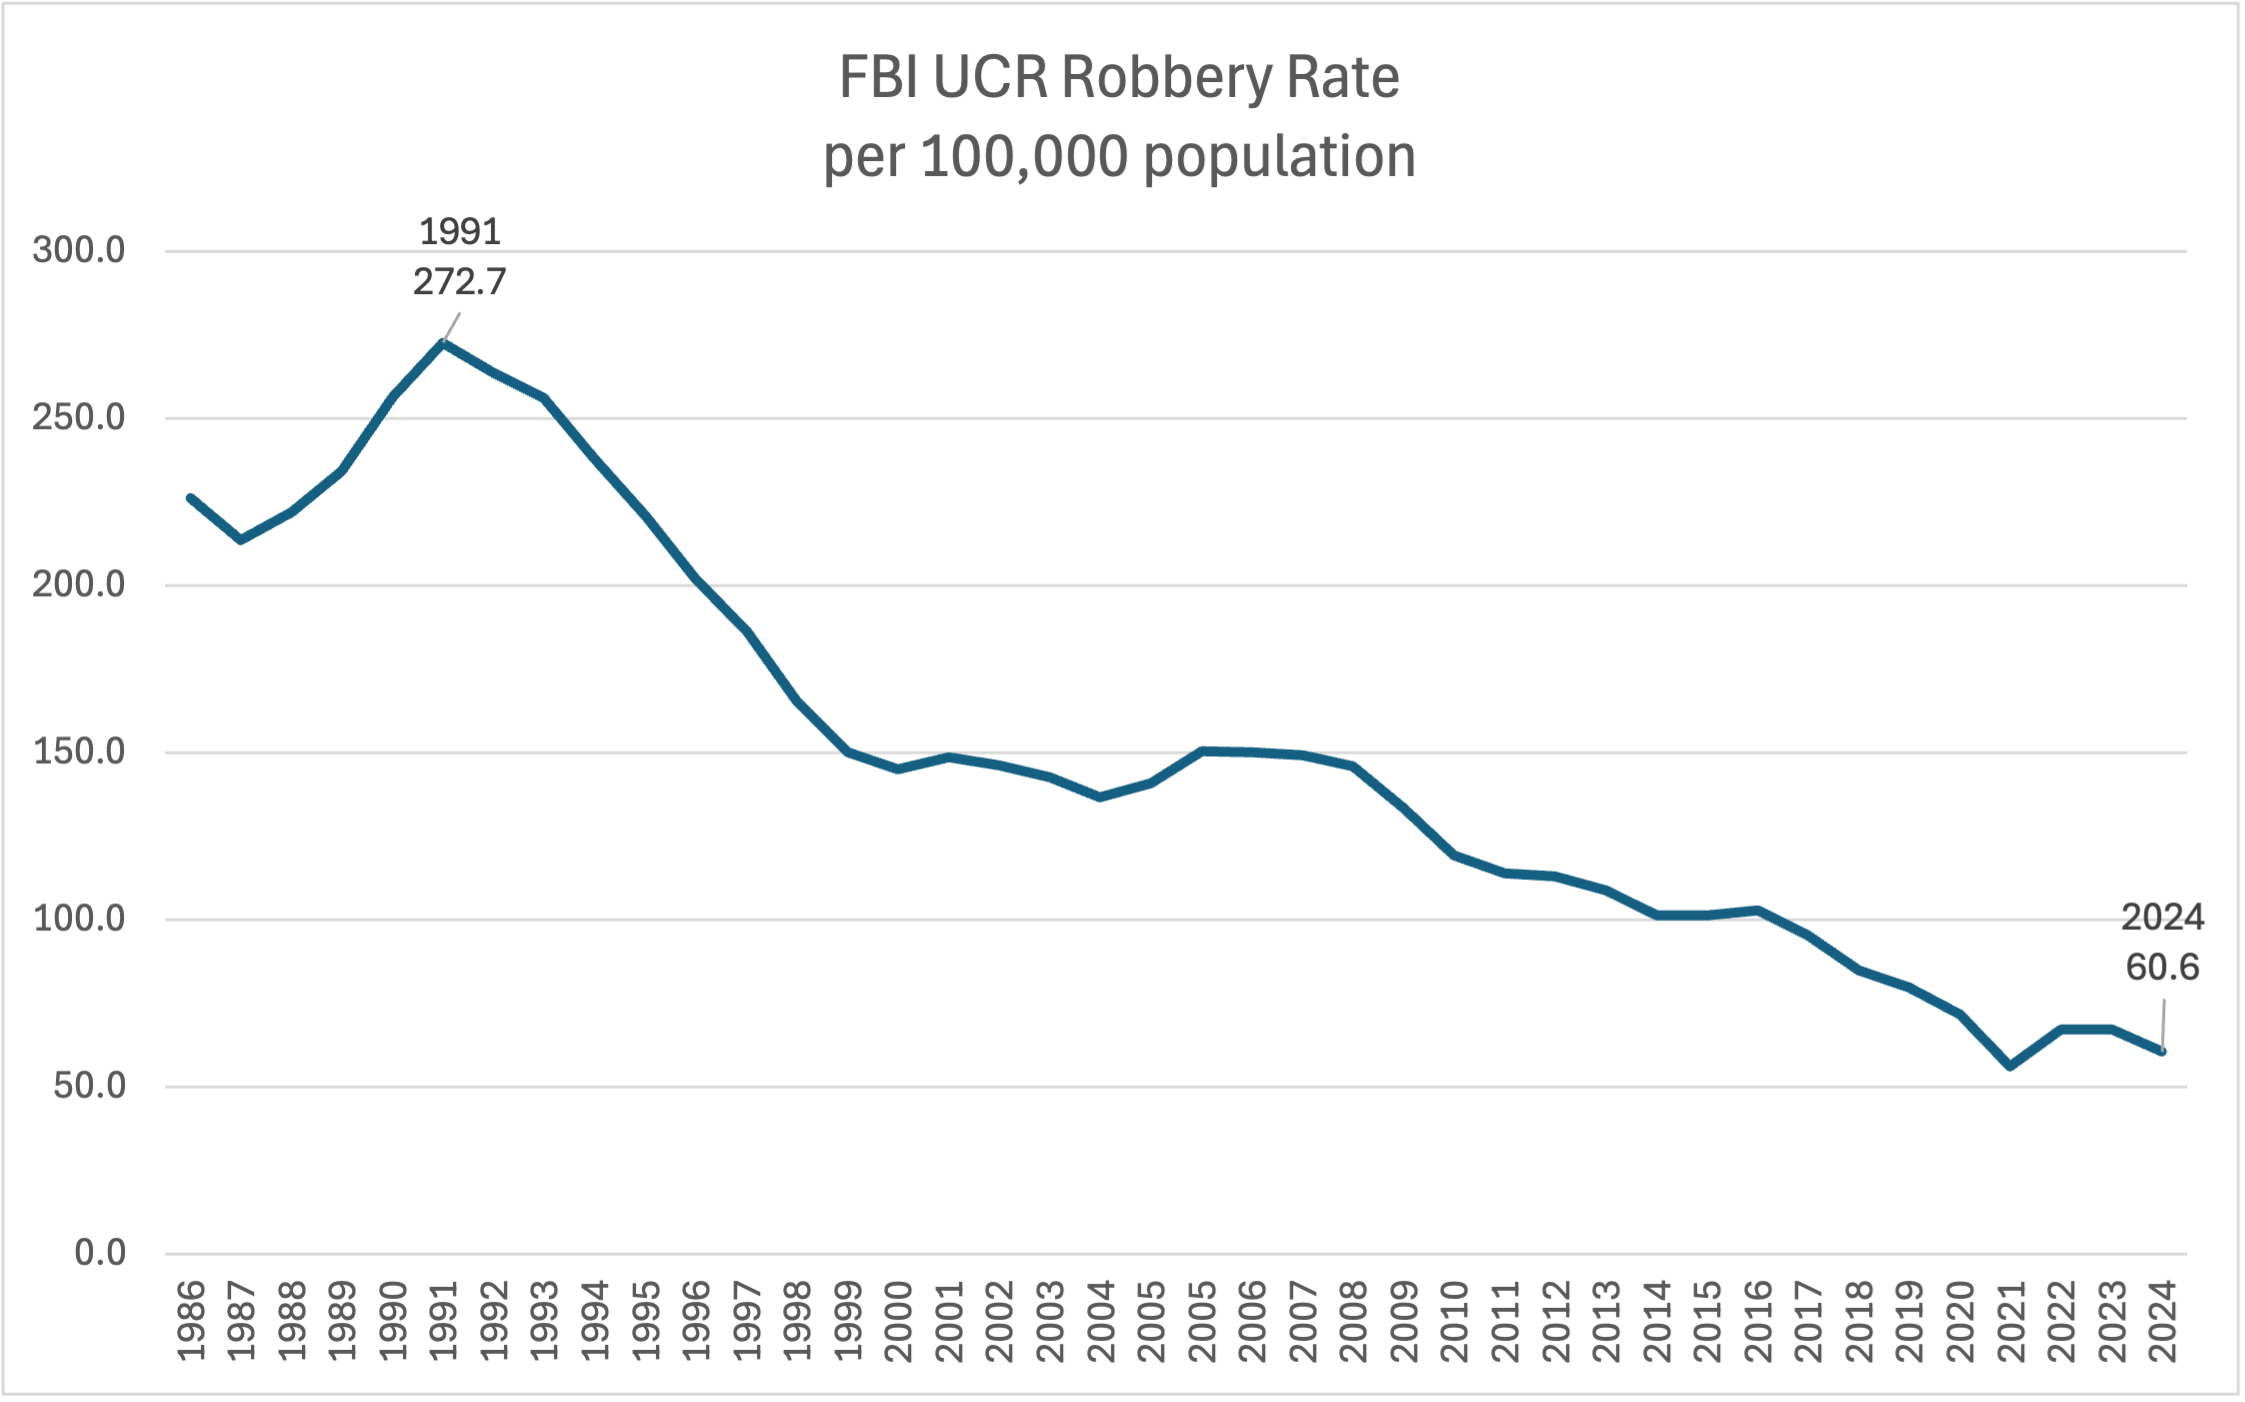
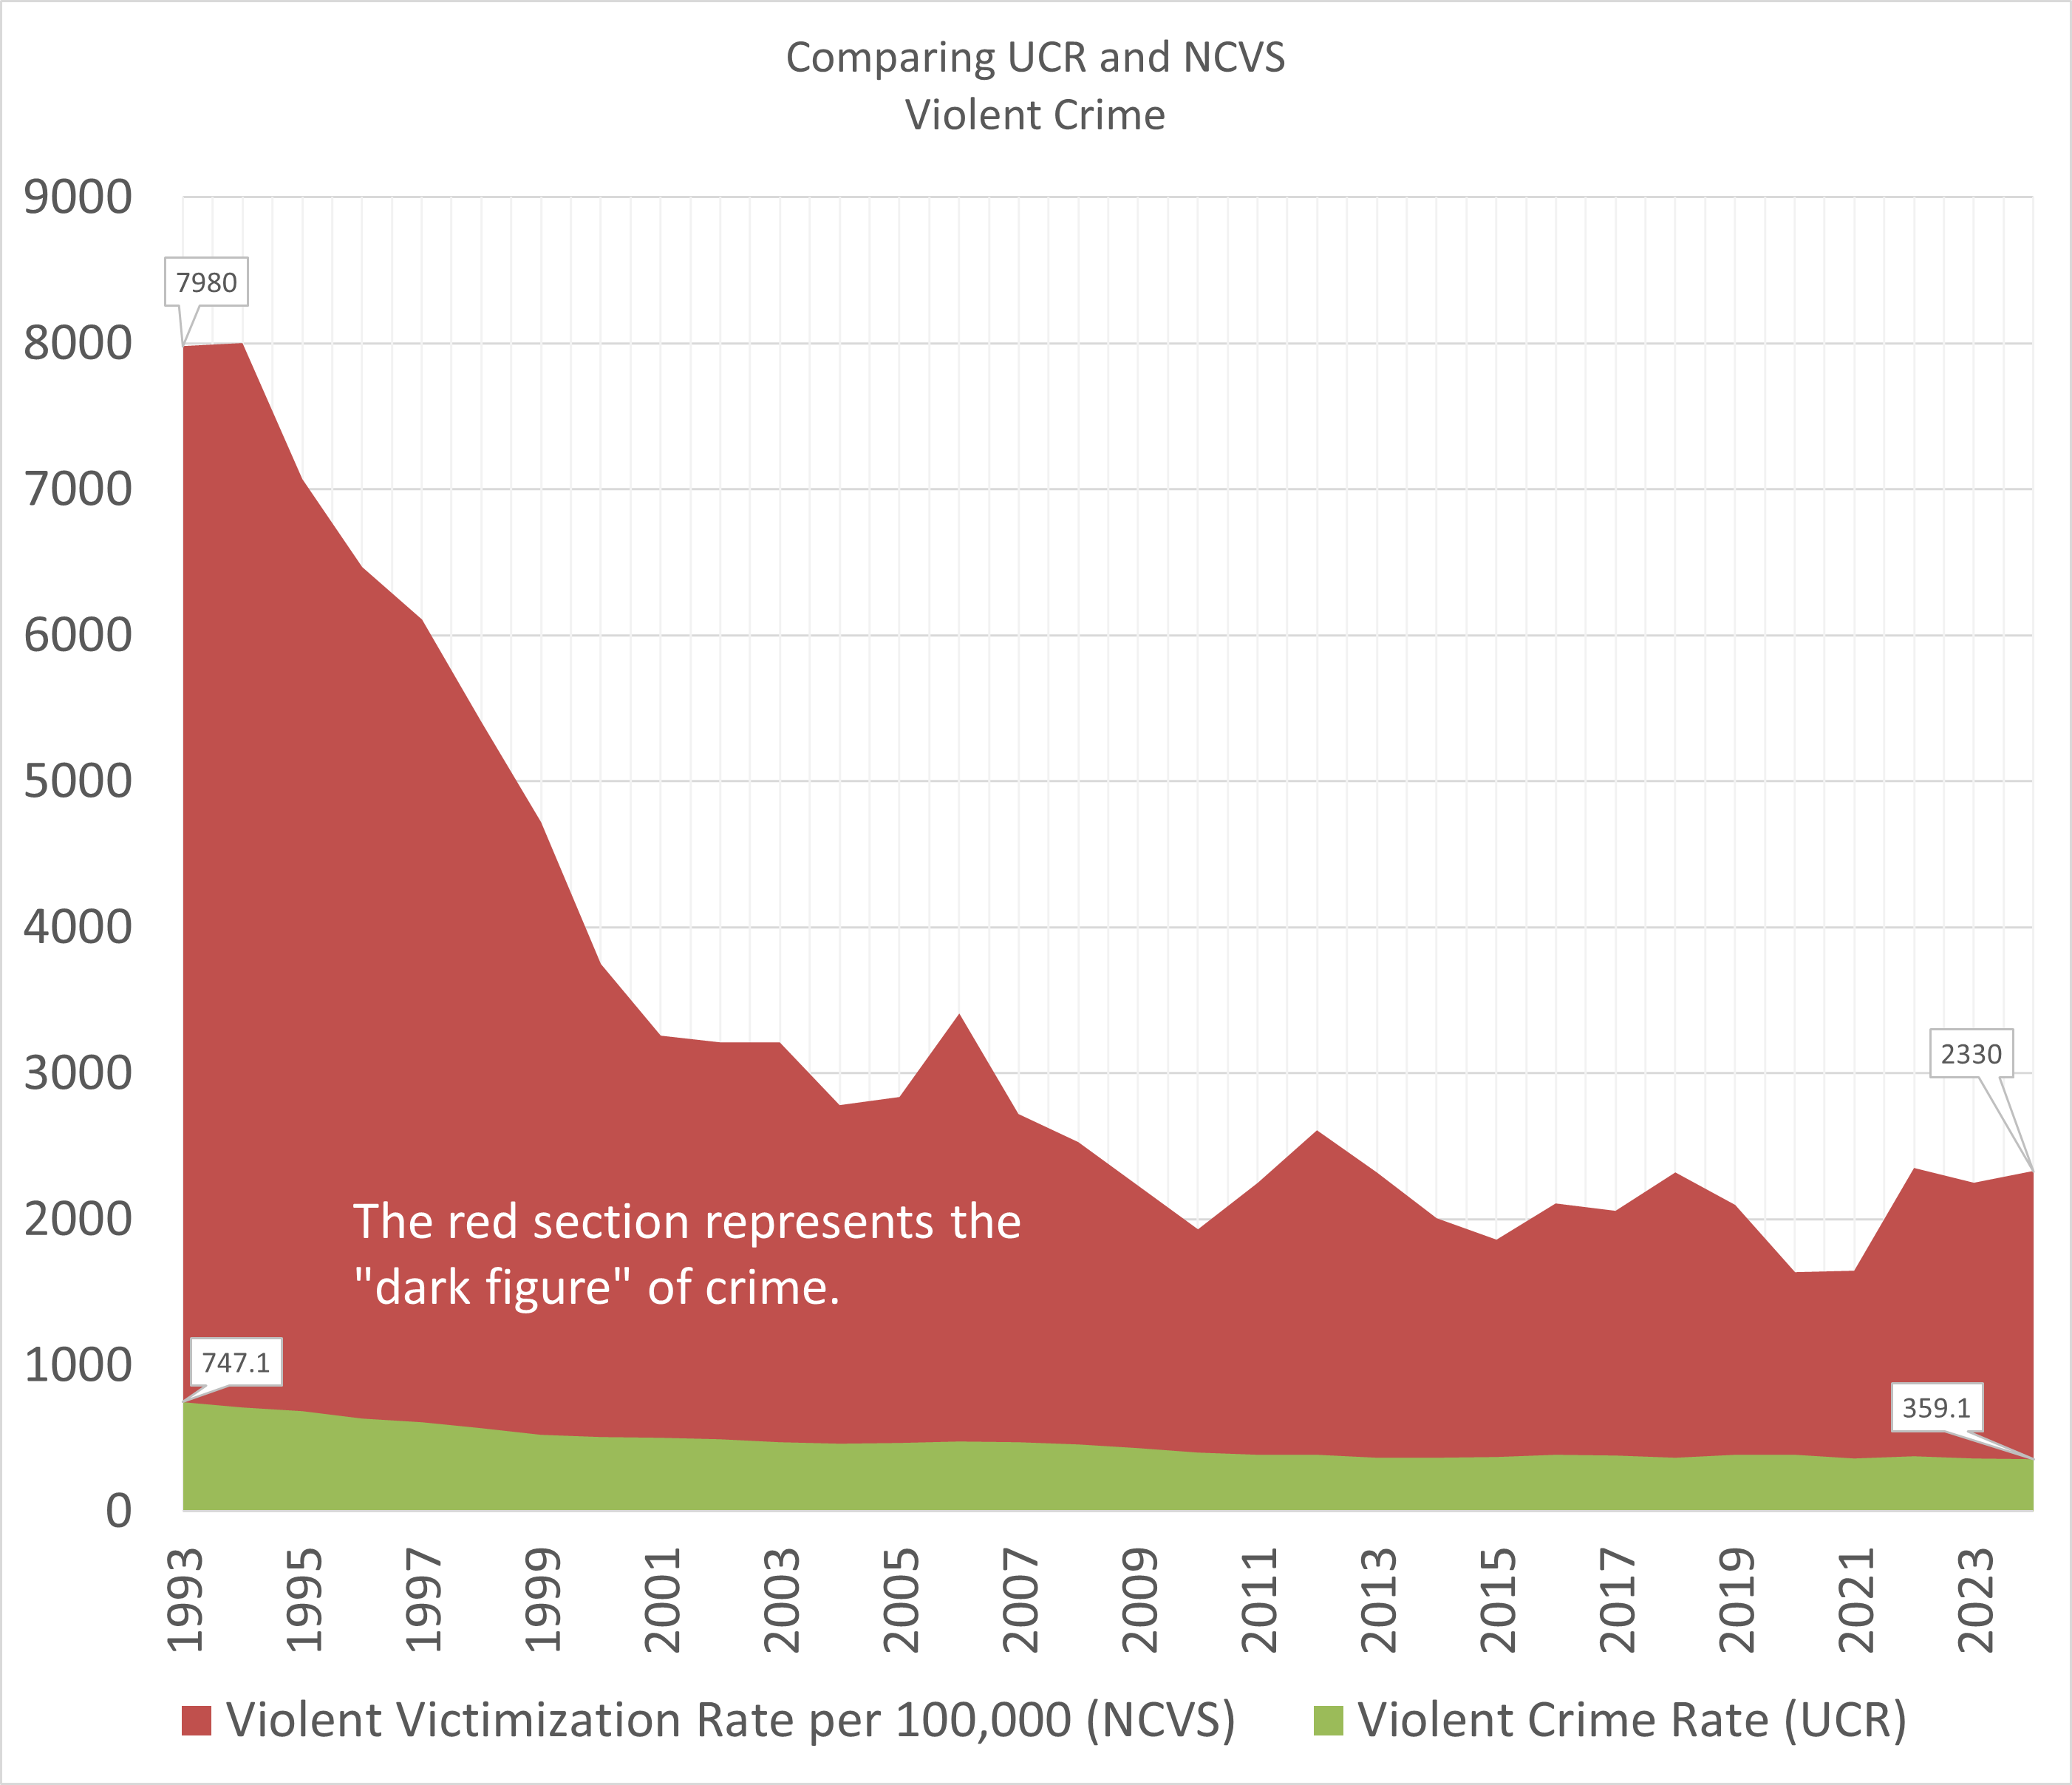
Violent Crime
Violent crime rates in the U.S. have generally declined since the early 1990s. Sources: FBI UCR, NCVS.
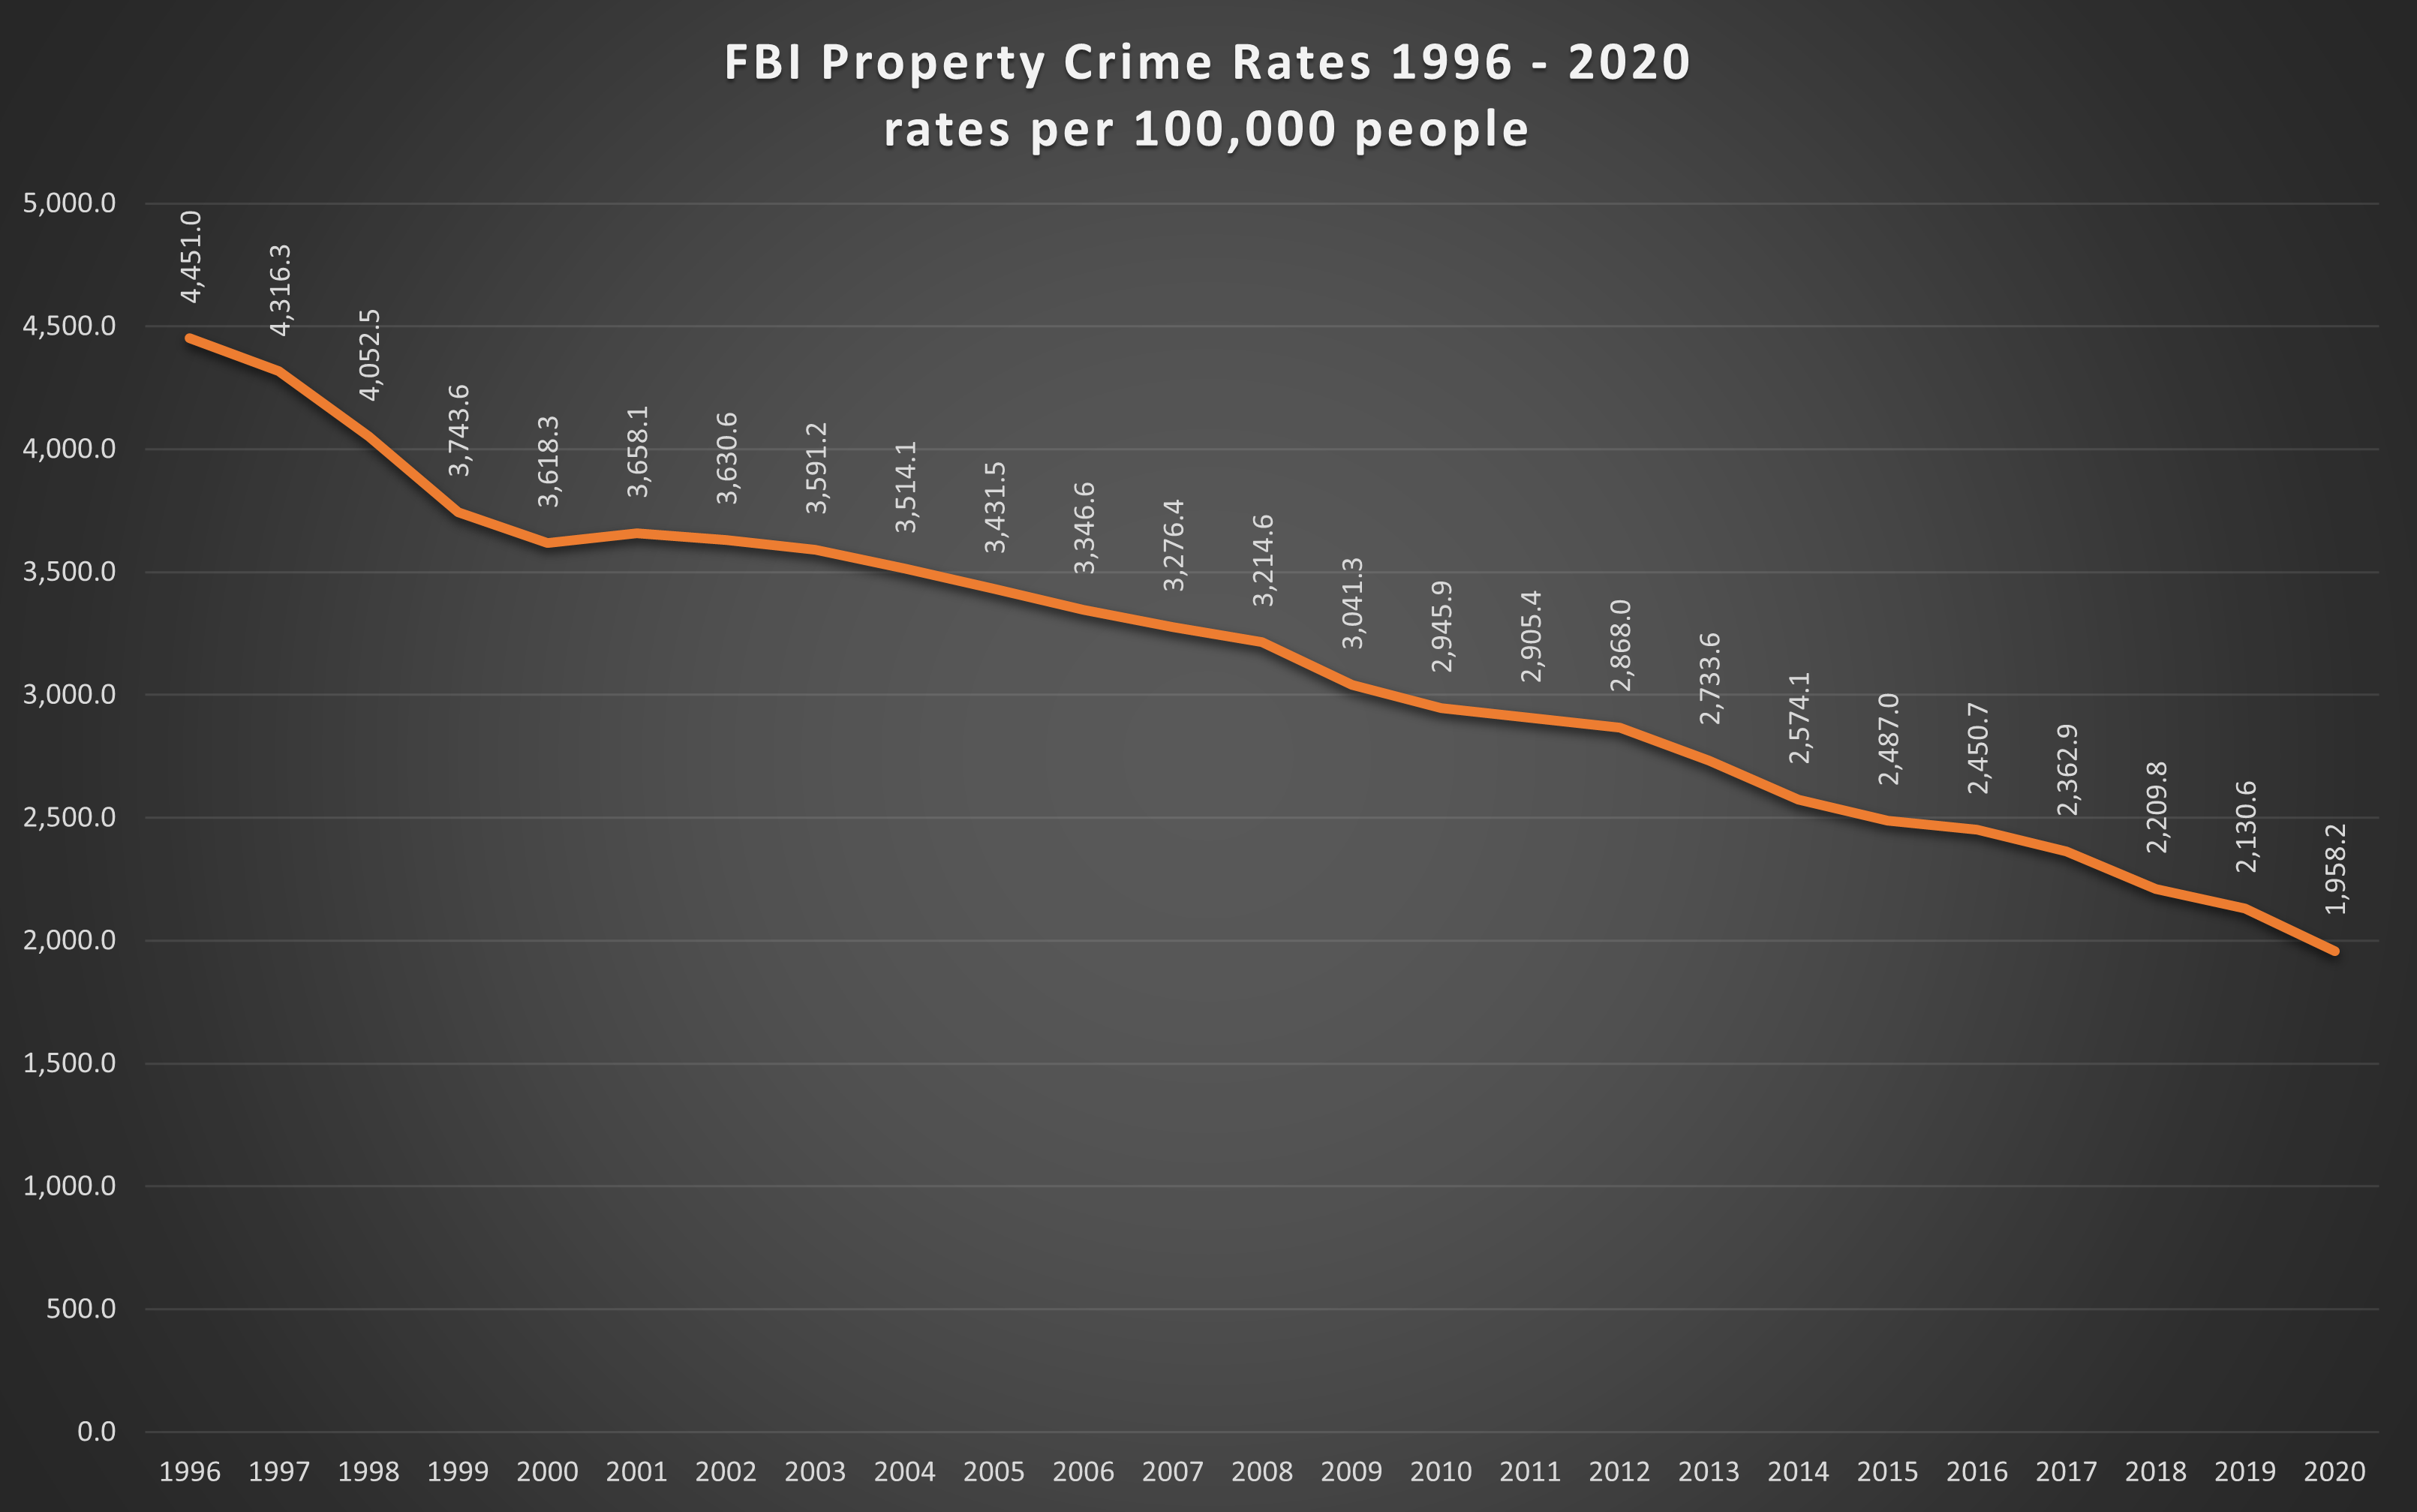
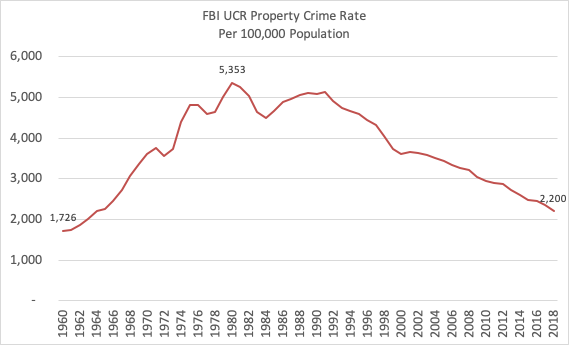
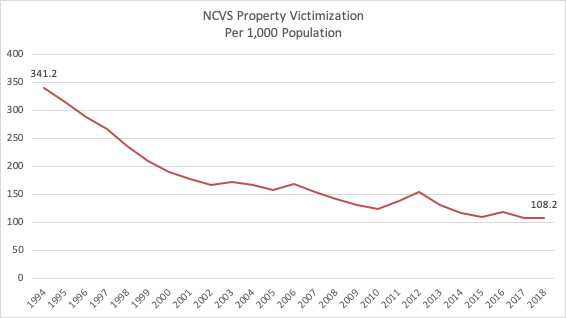
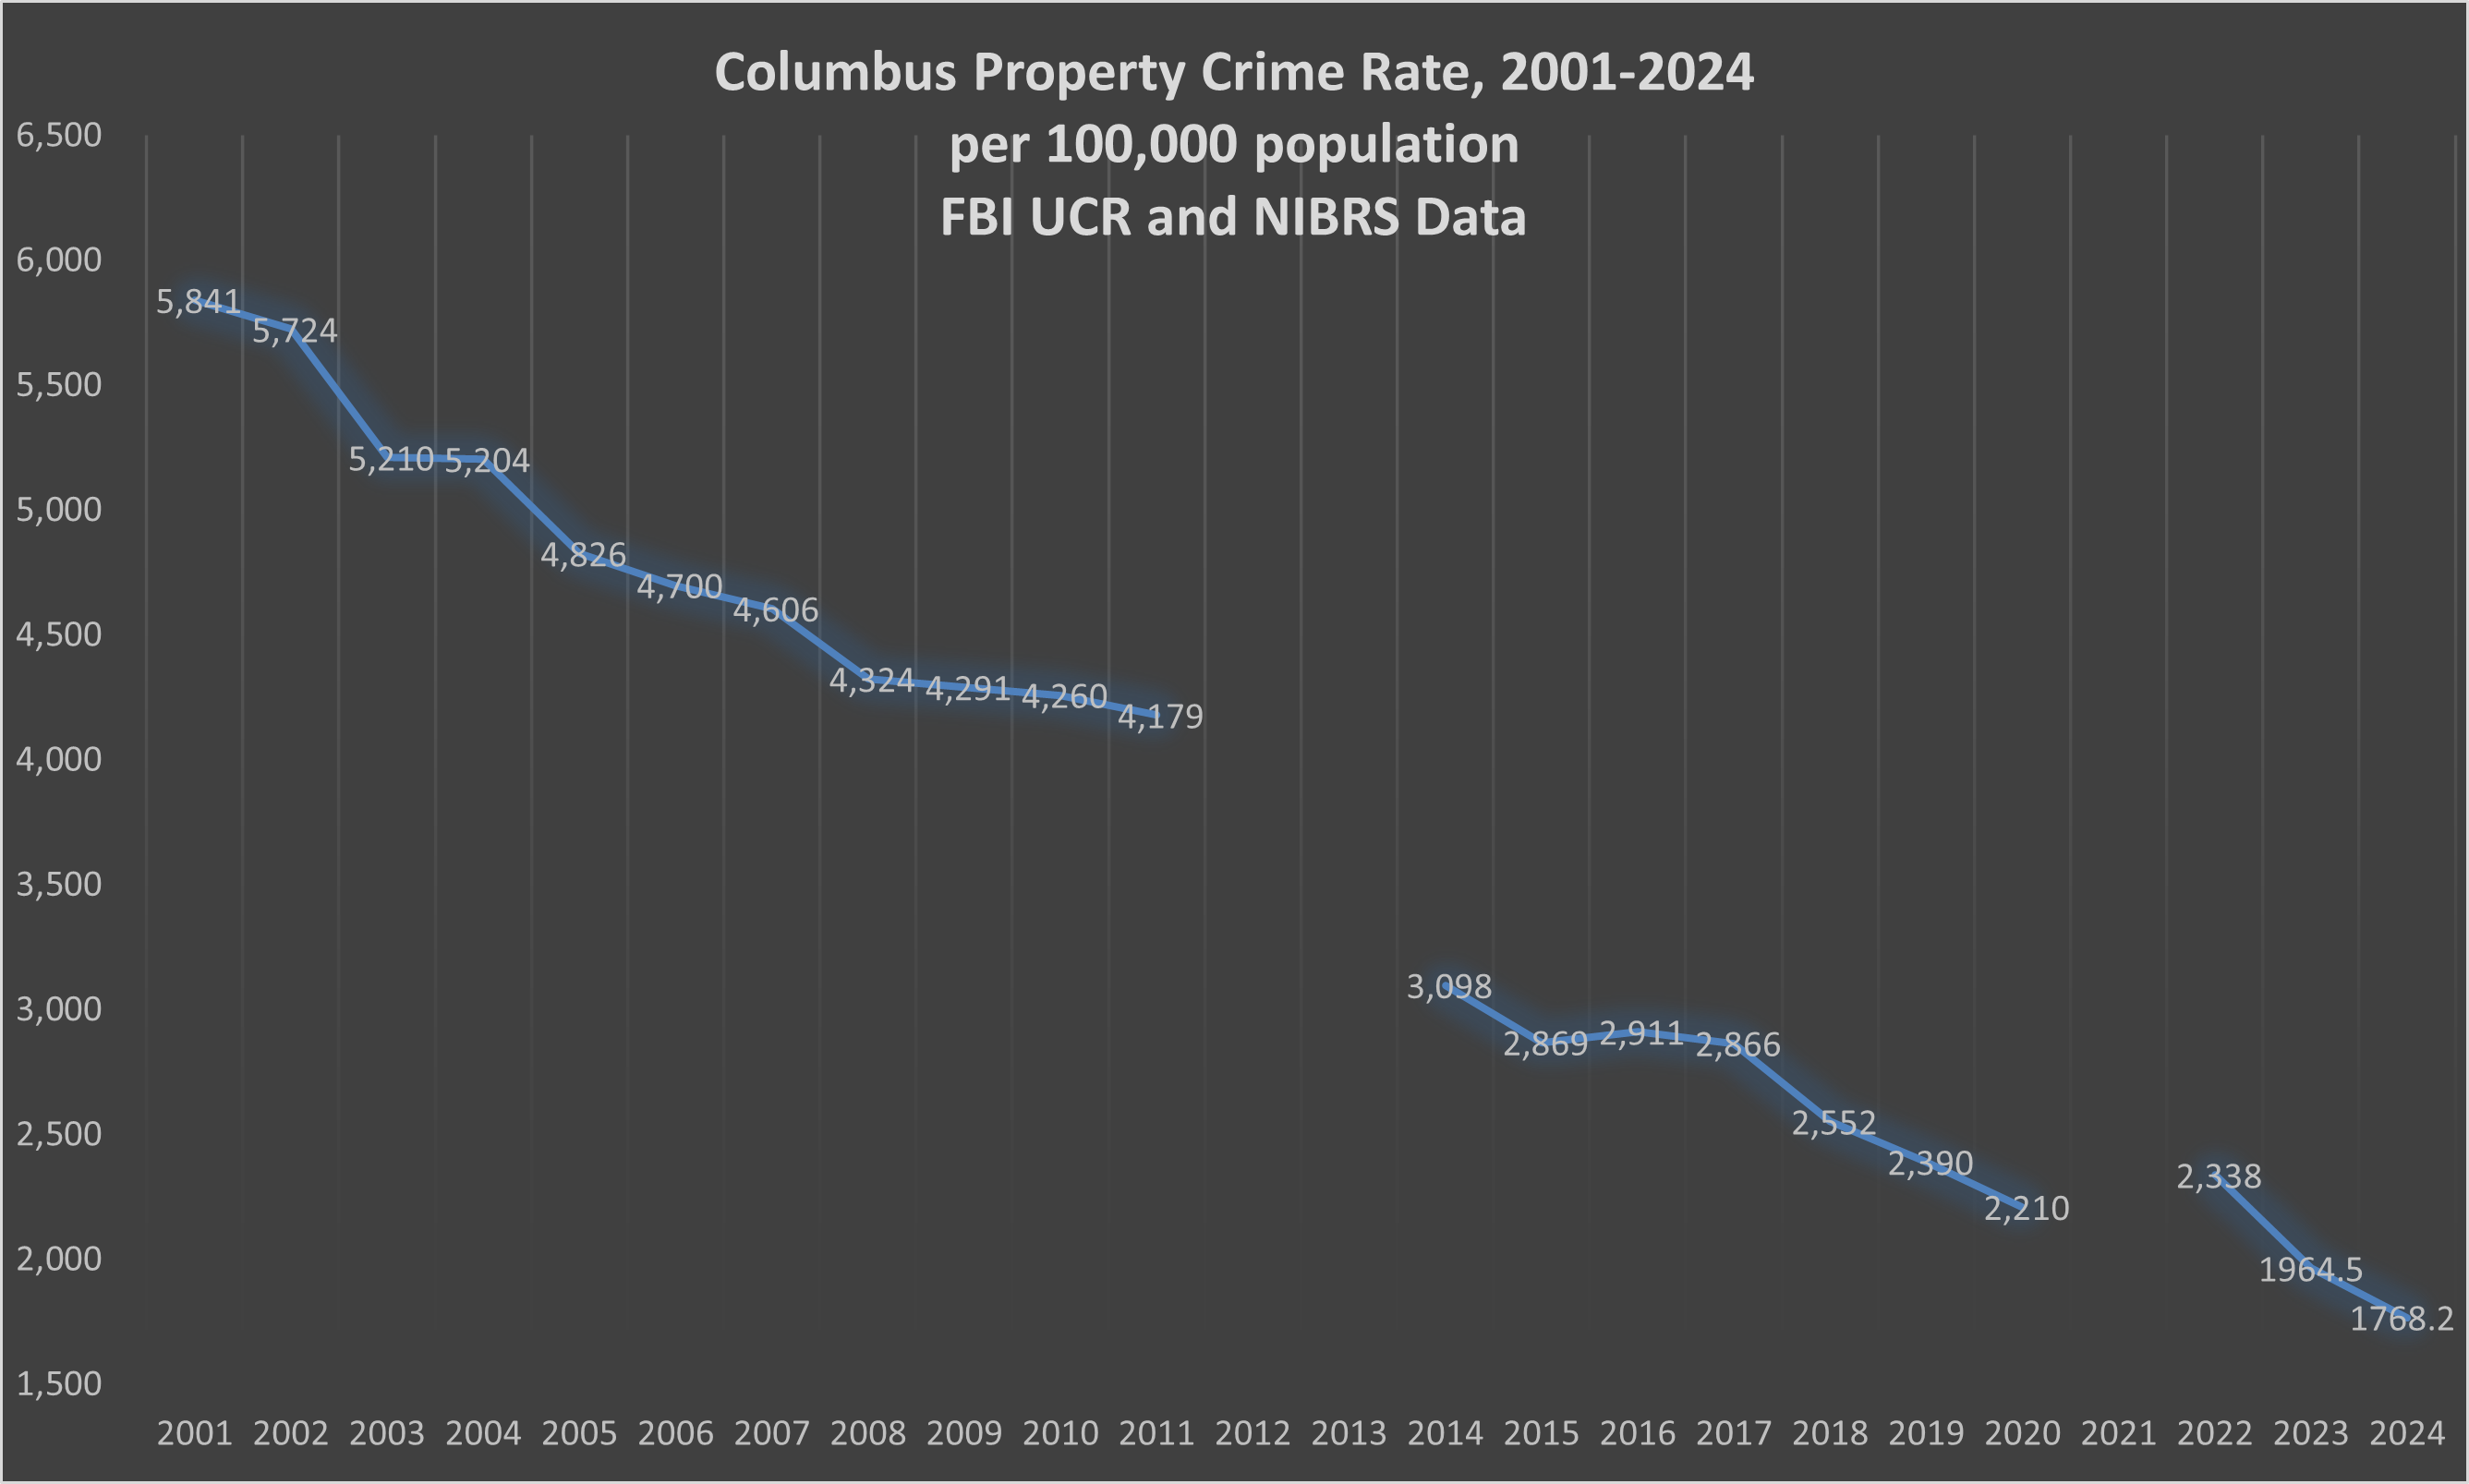
Property Crime
Property crime rates in the U.S. have been falling for nearly 25 years. Sources: FBI UCR, NCVS.
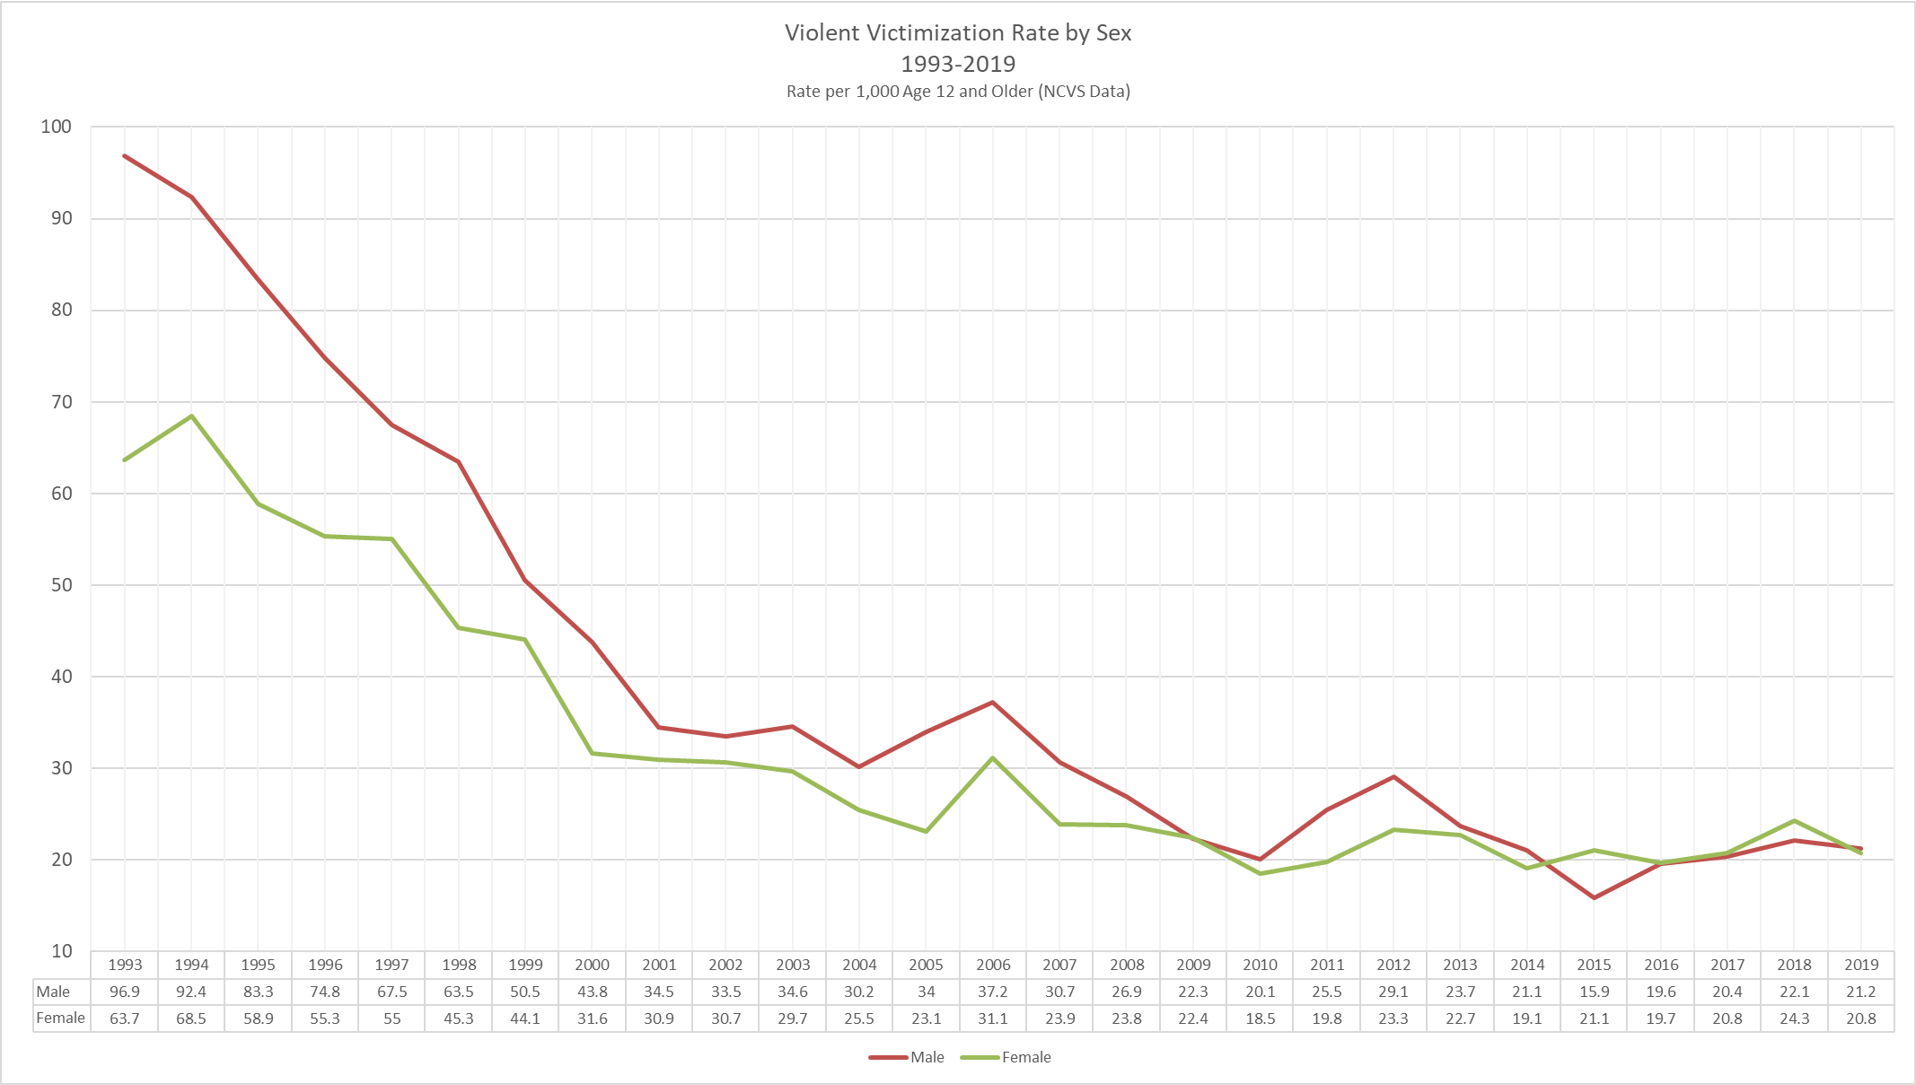
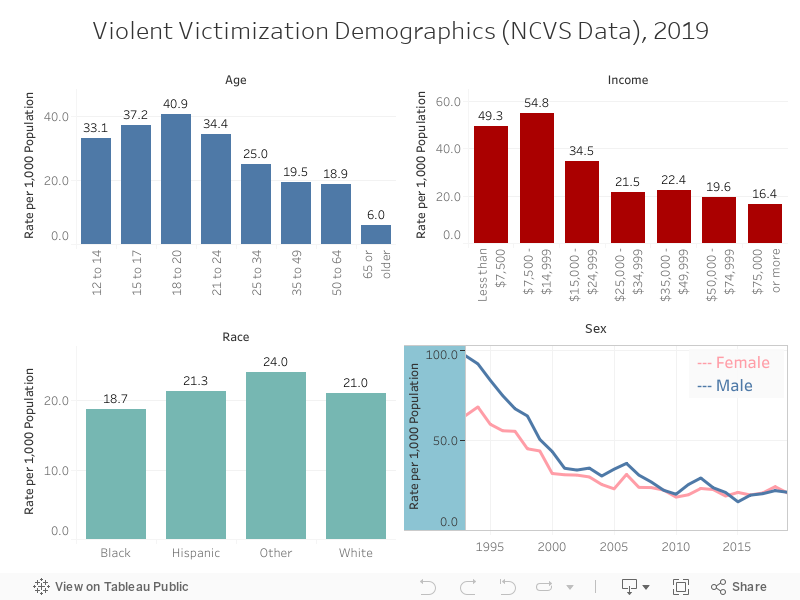
Victimization
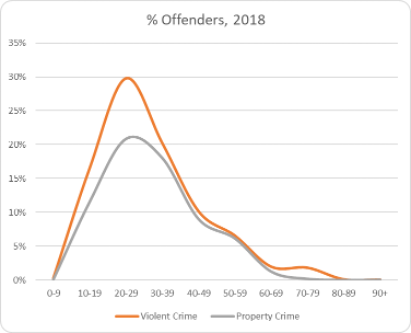
In general, victims match the demographics of offenders. Crime victims tend to be young and poor; victimization rates for men and women are nearly equal; minorities are over-represented as victims. Source: NCVS.
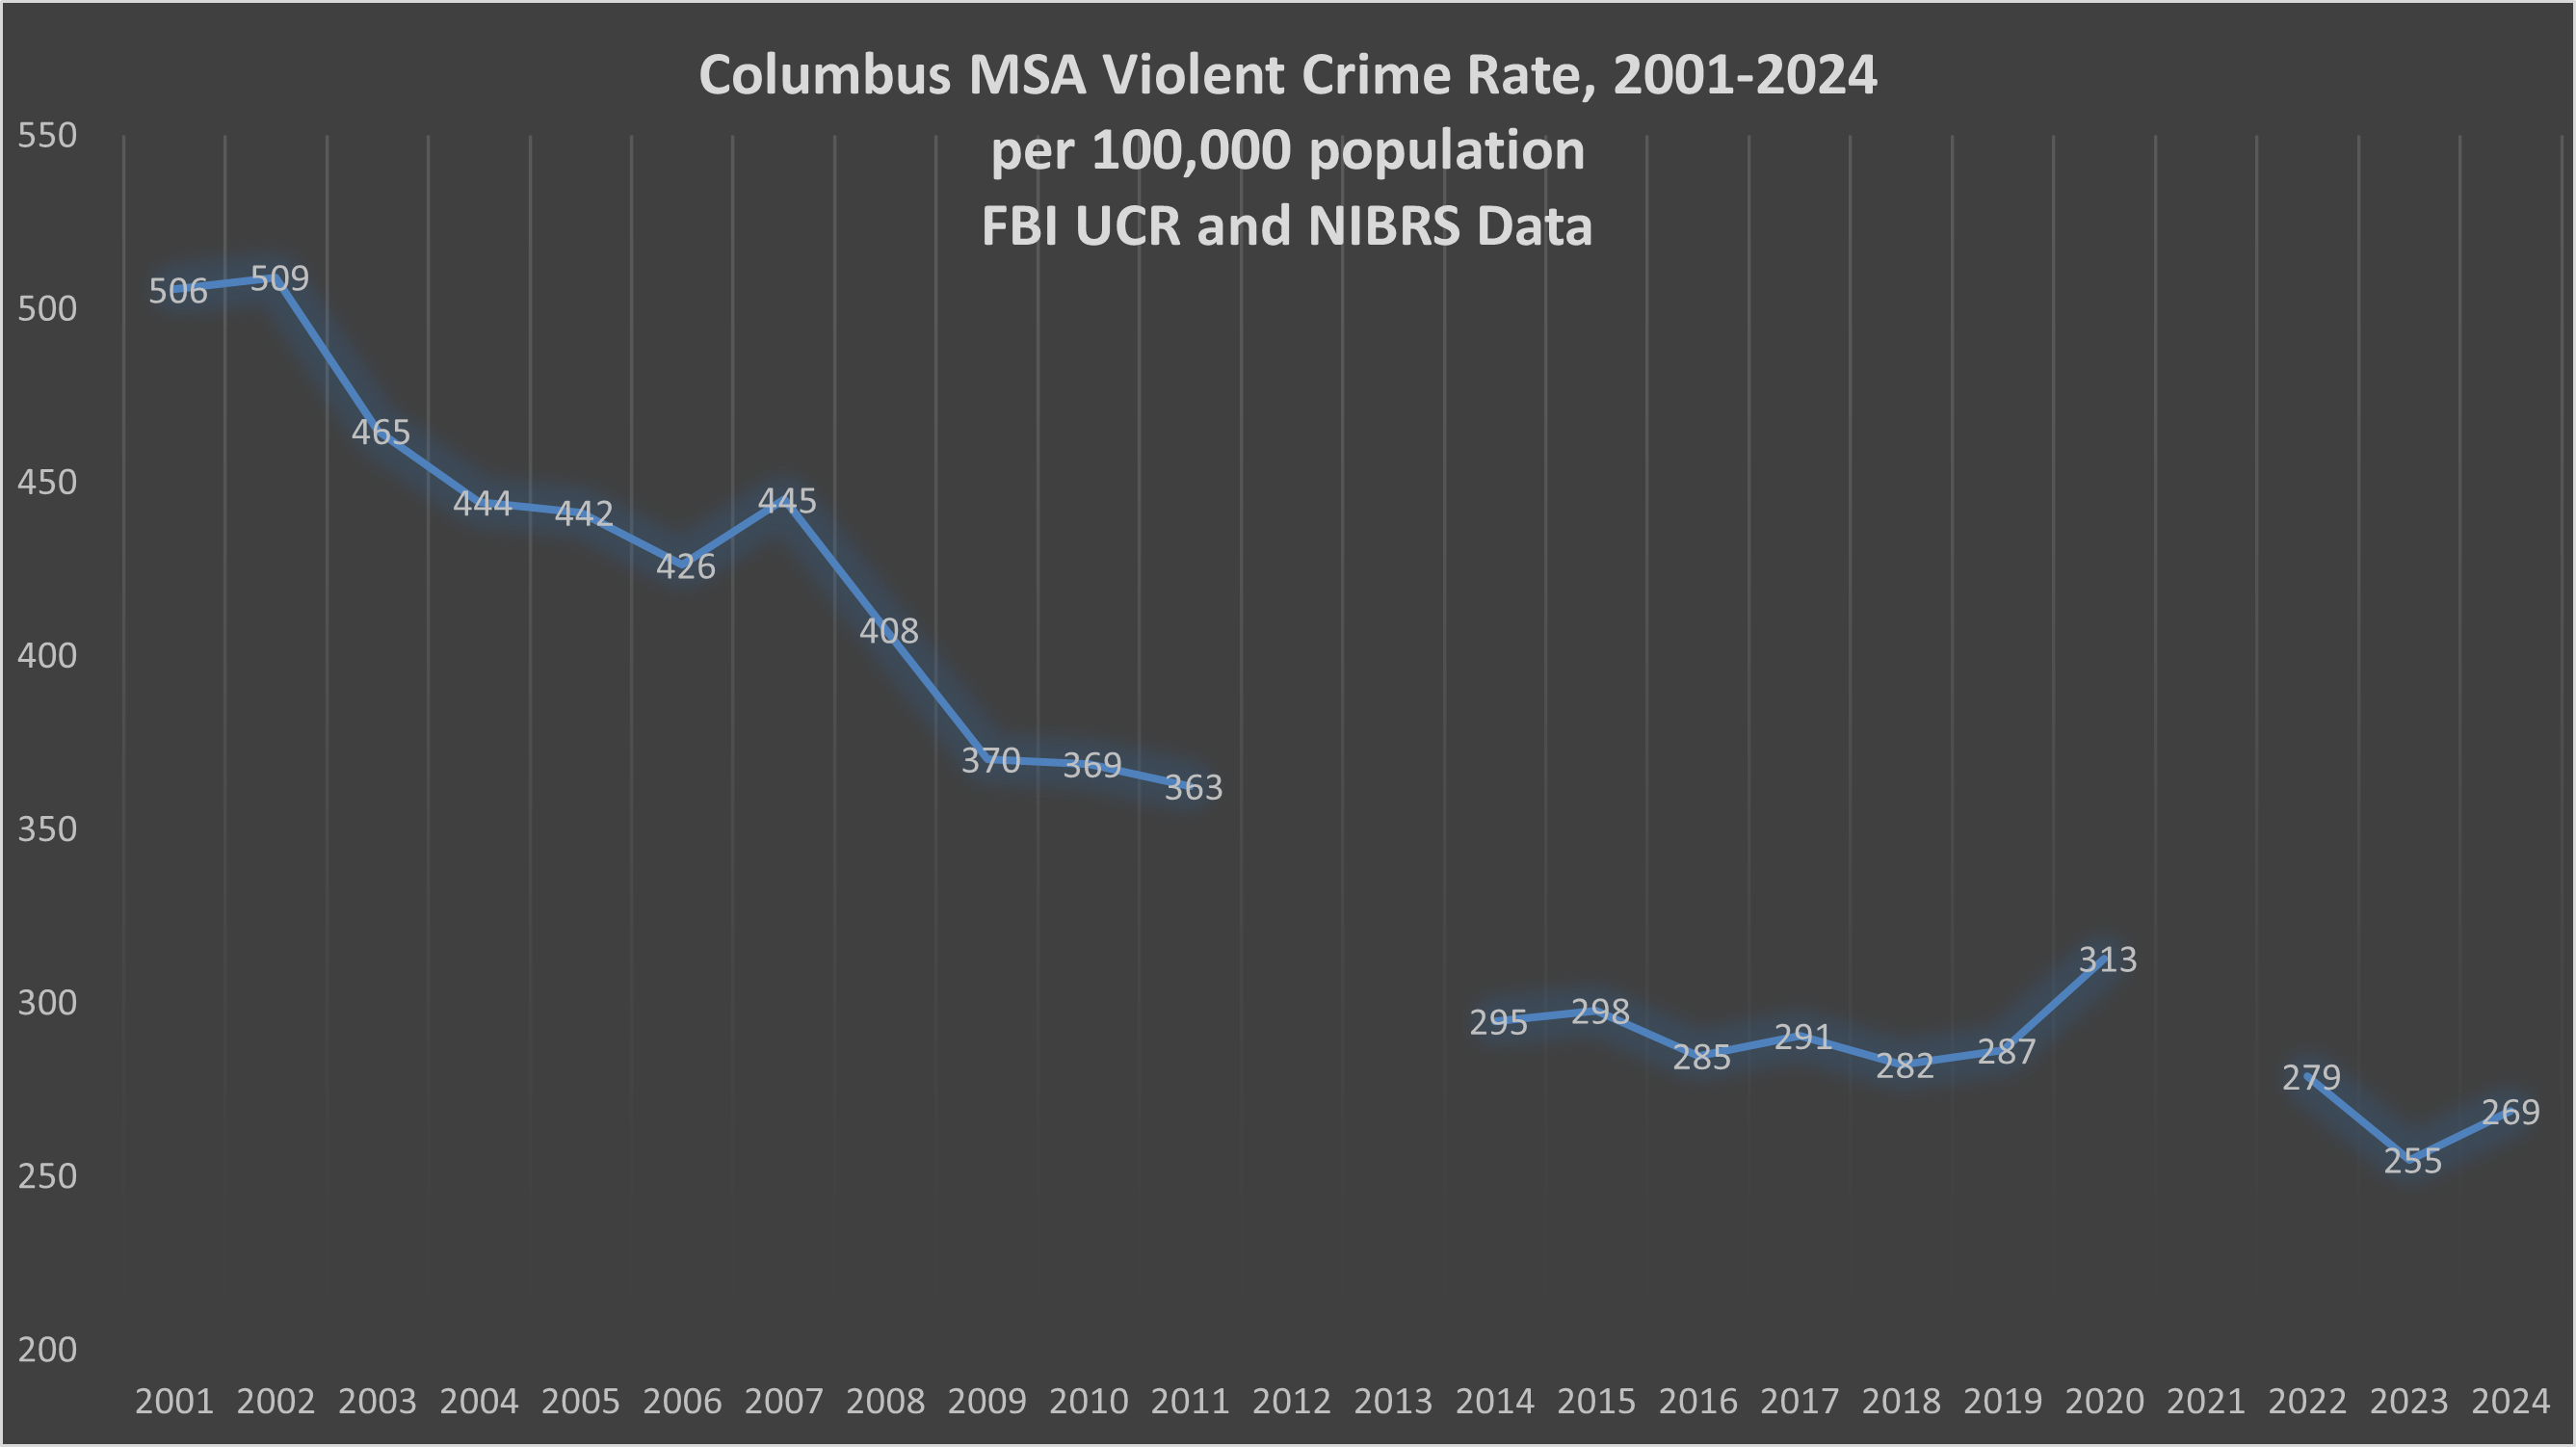
Columbus, Ohio
Crime in Columbus, like most U.S. cities, is down overall. There was a sharp increase in homicide and a slight increase in violent crime in 2020. The homicide rate for the city and MSA has decreased slightly over the long run despite population growth.
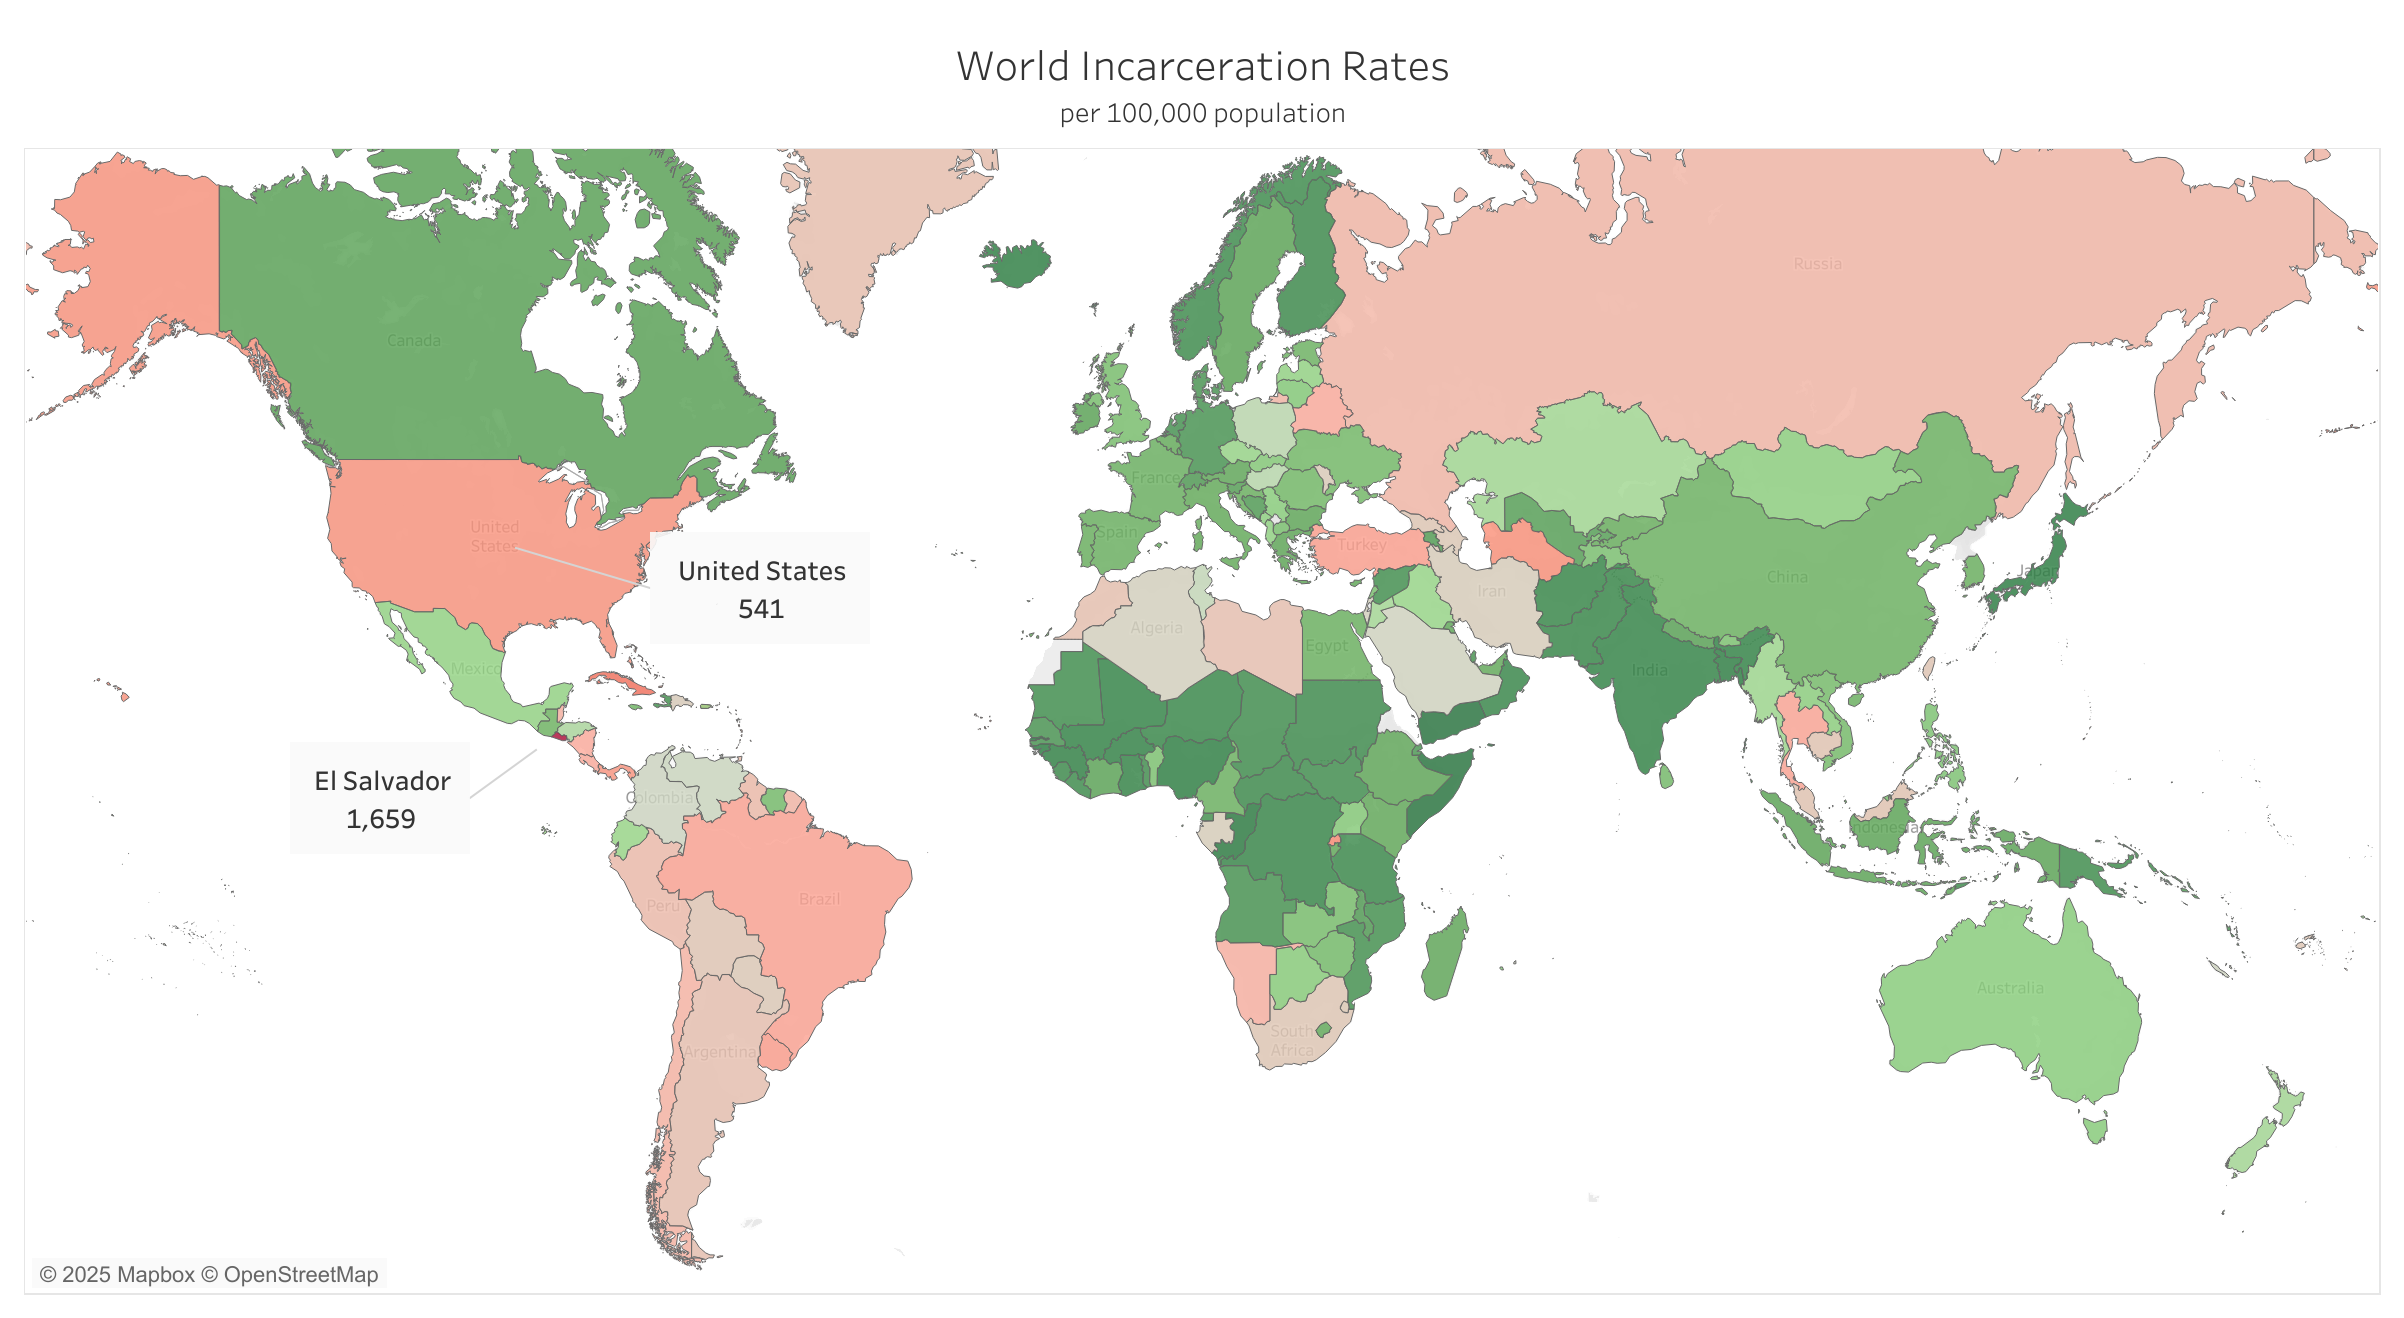
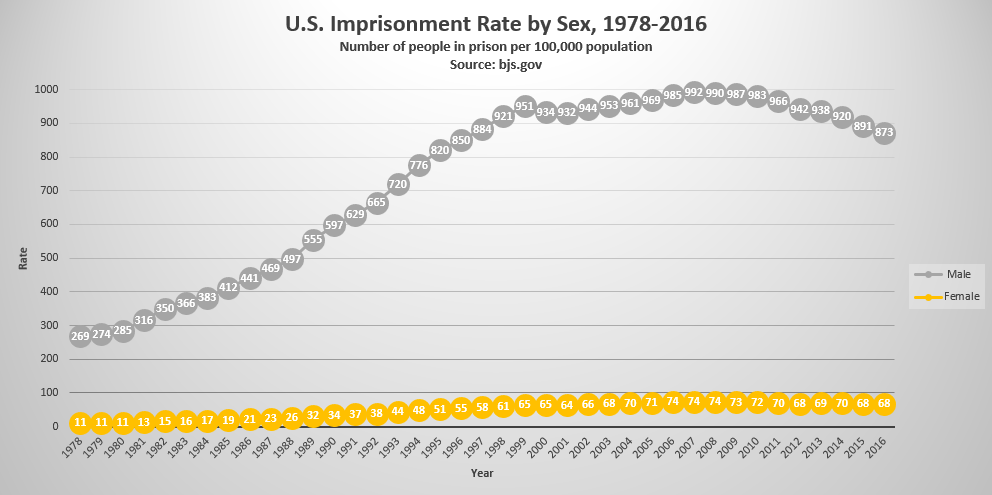
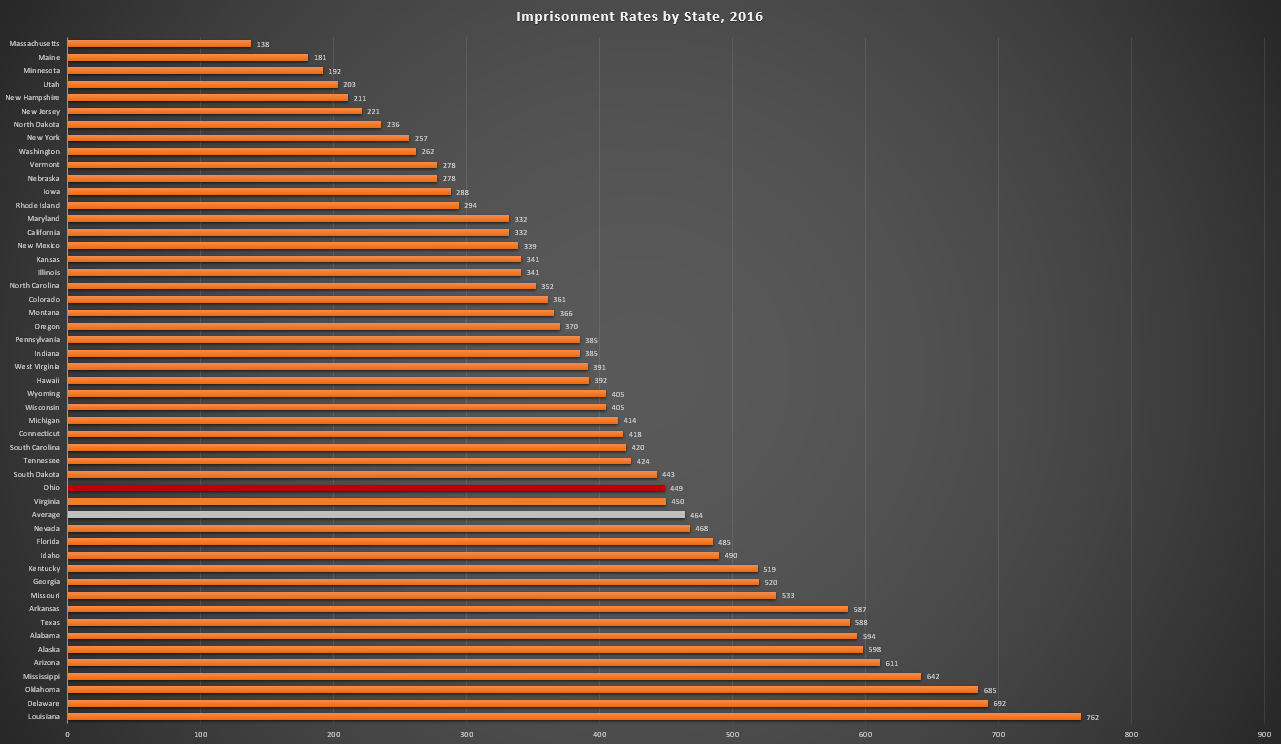
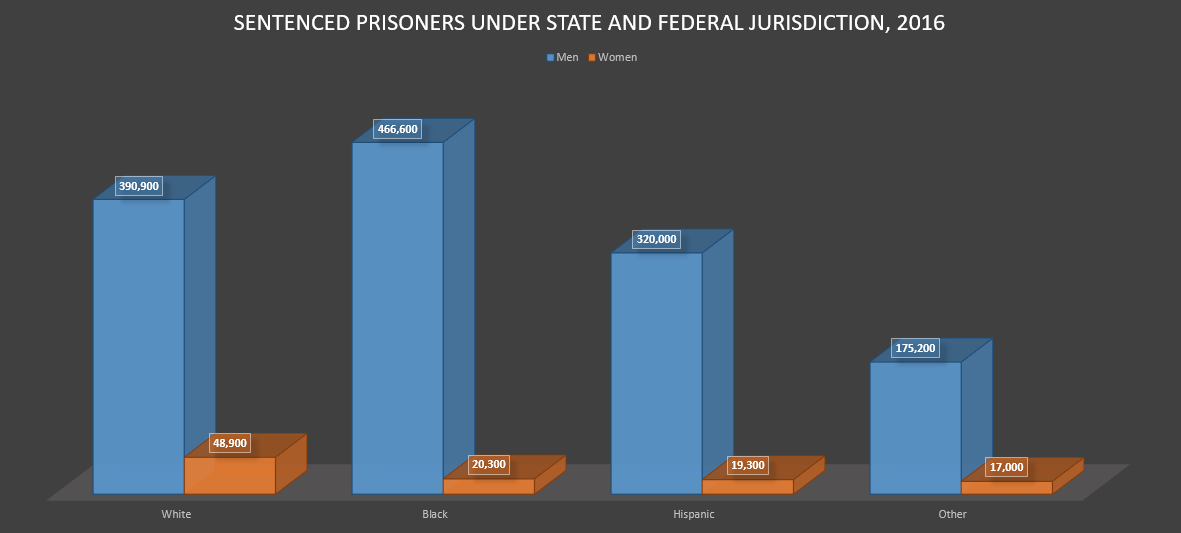
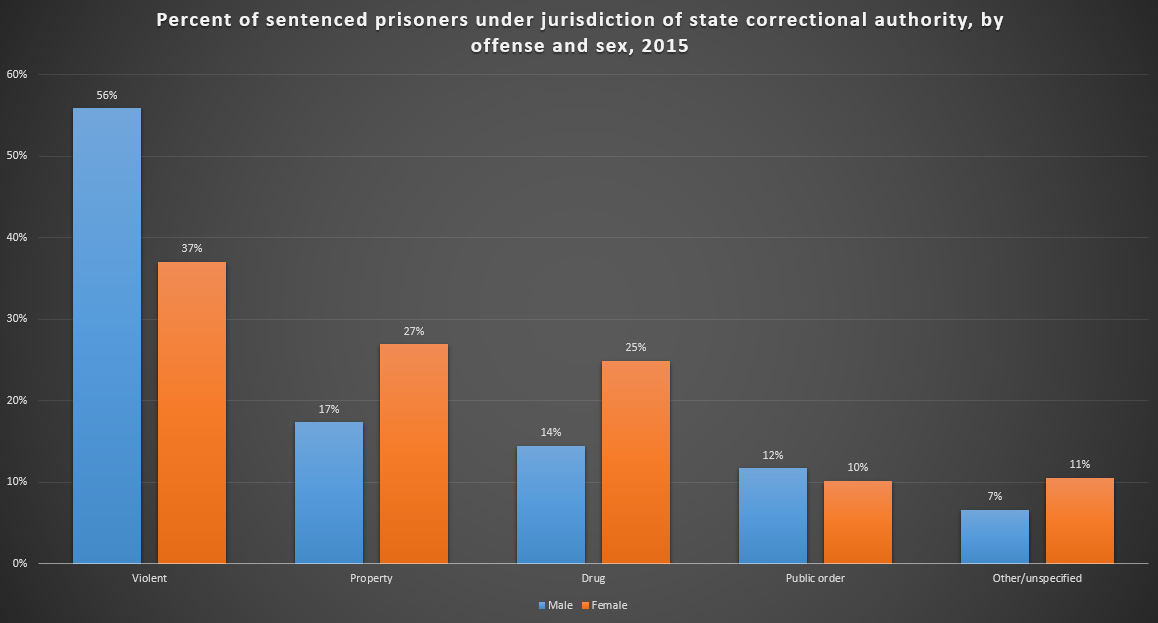
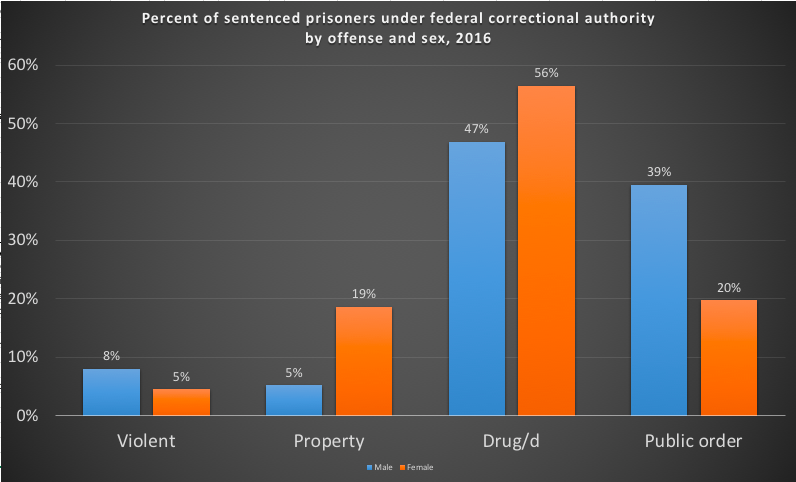
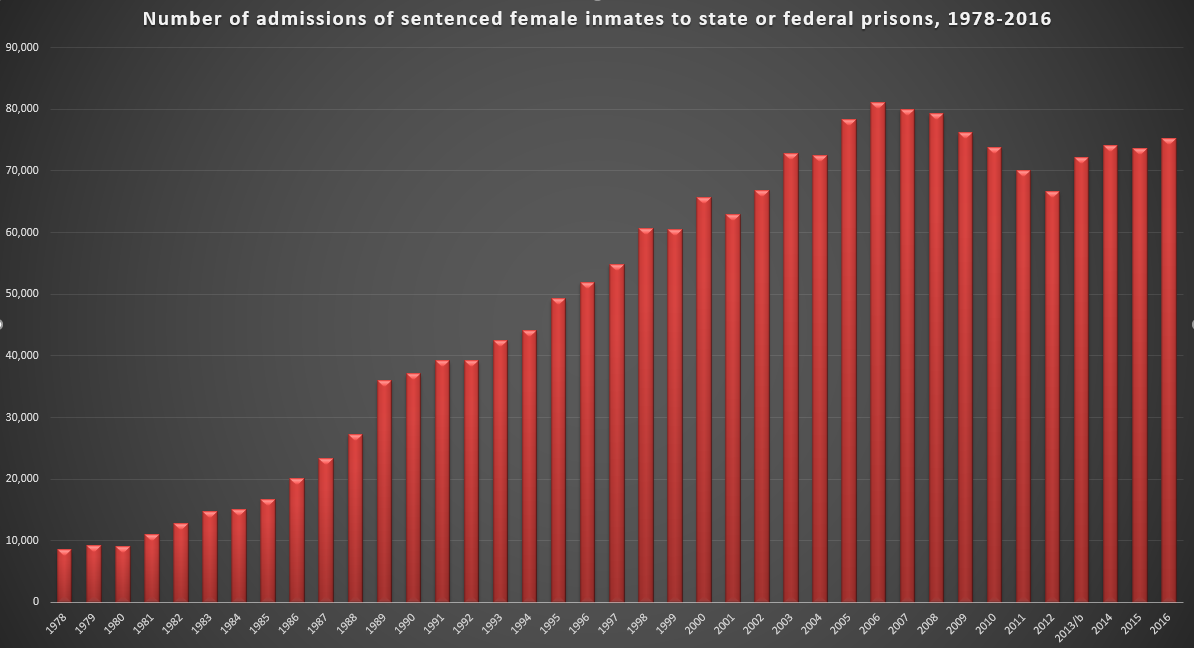
Incarceration
The United States has the highest incarceration rate in the world. Rates vary substantially by state, sex, and race. Source: Bureau of Justice Statistics (BJS).
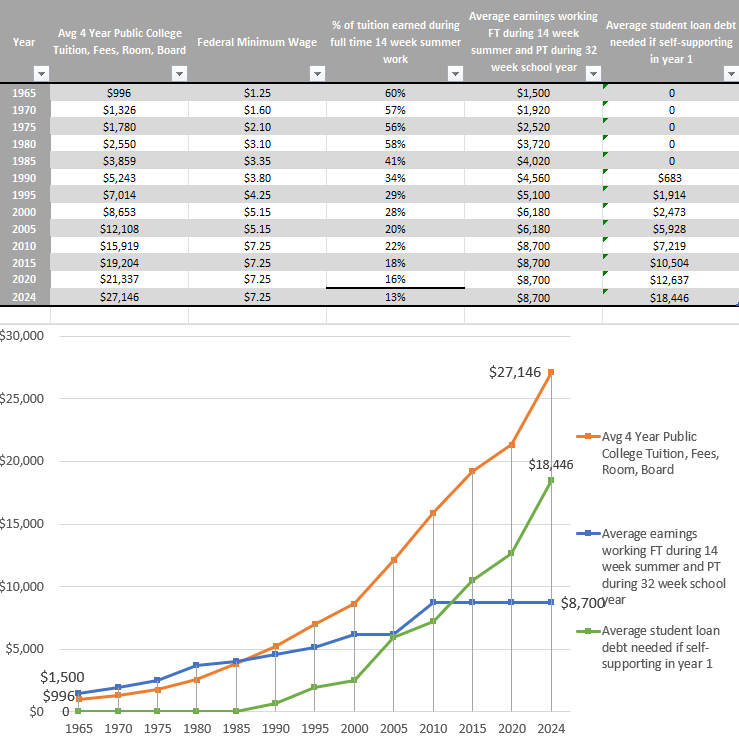
Education & Economic Context
The cost of a college degree has increased at a much faster pace than wages. Students today are much more likely to need to take out a student loan in order to pay for their degree. Sources: U.S. Department of Labor, College Board.
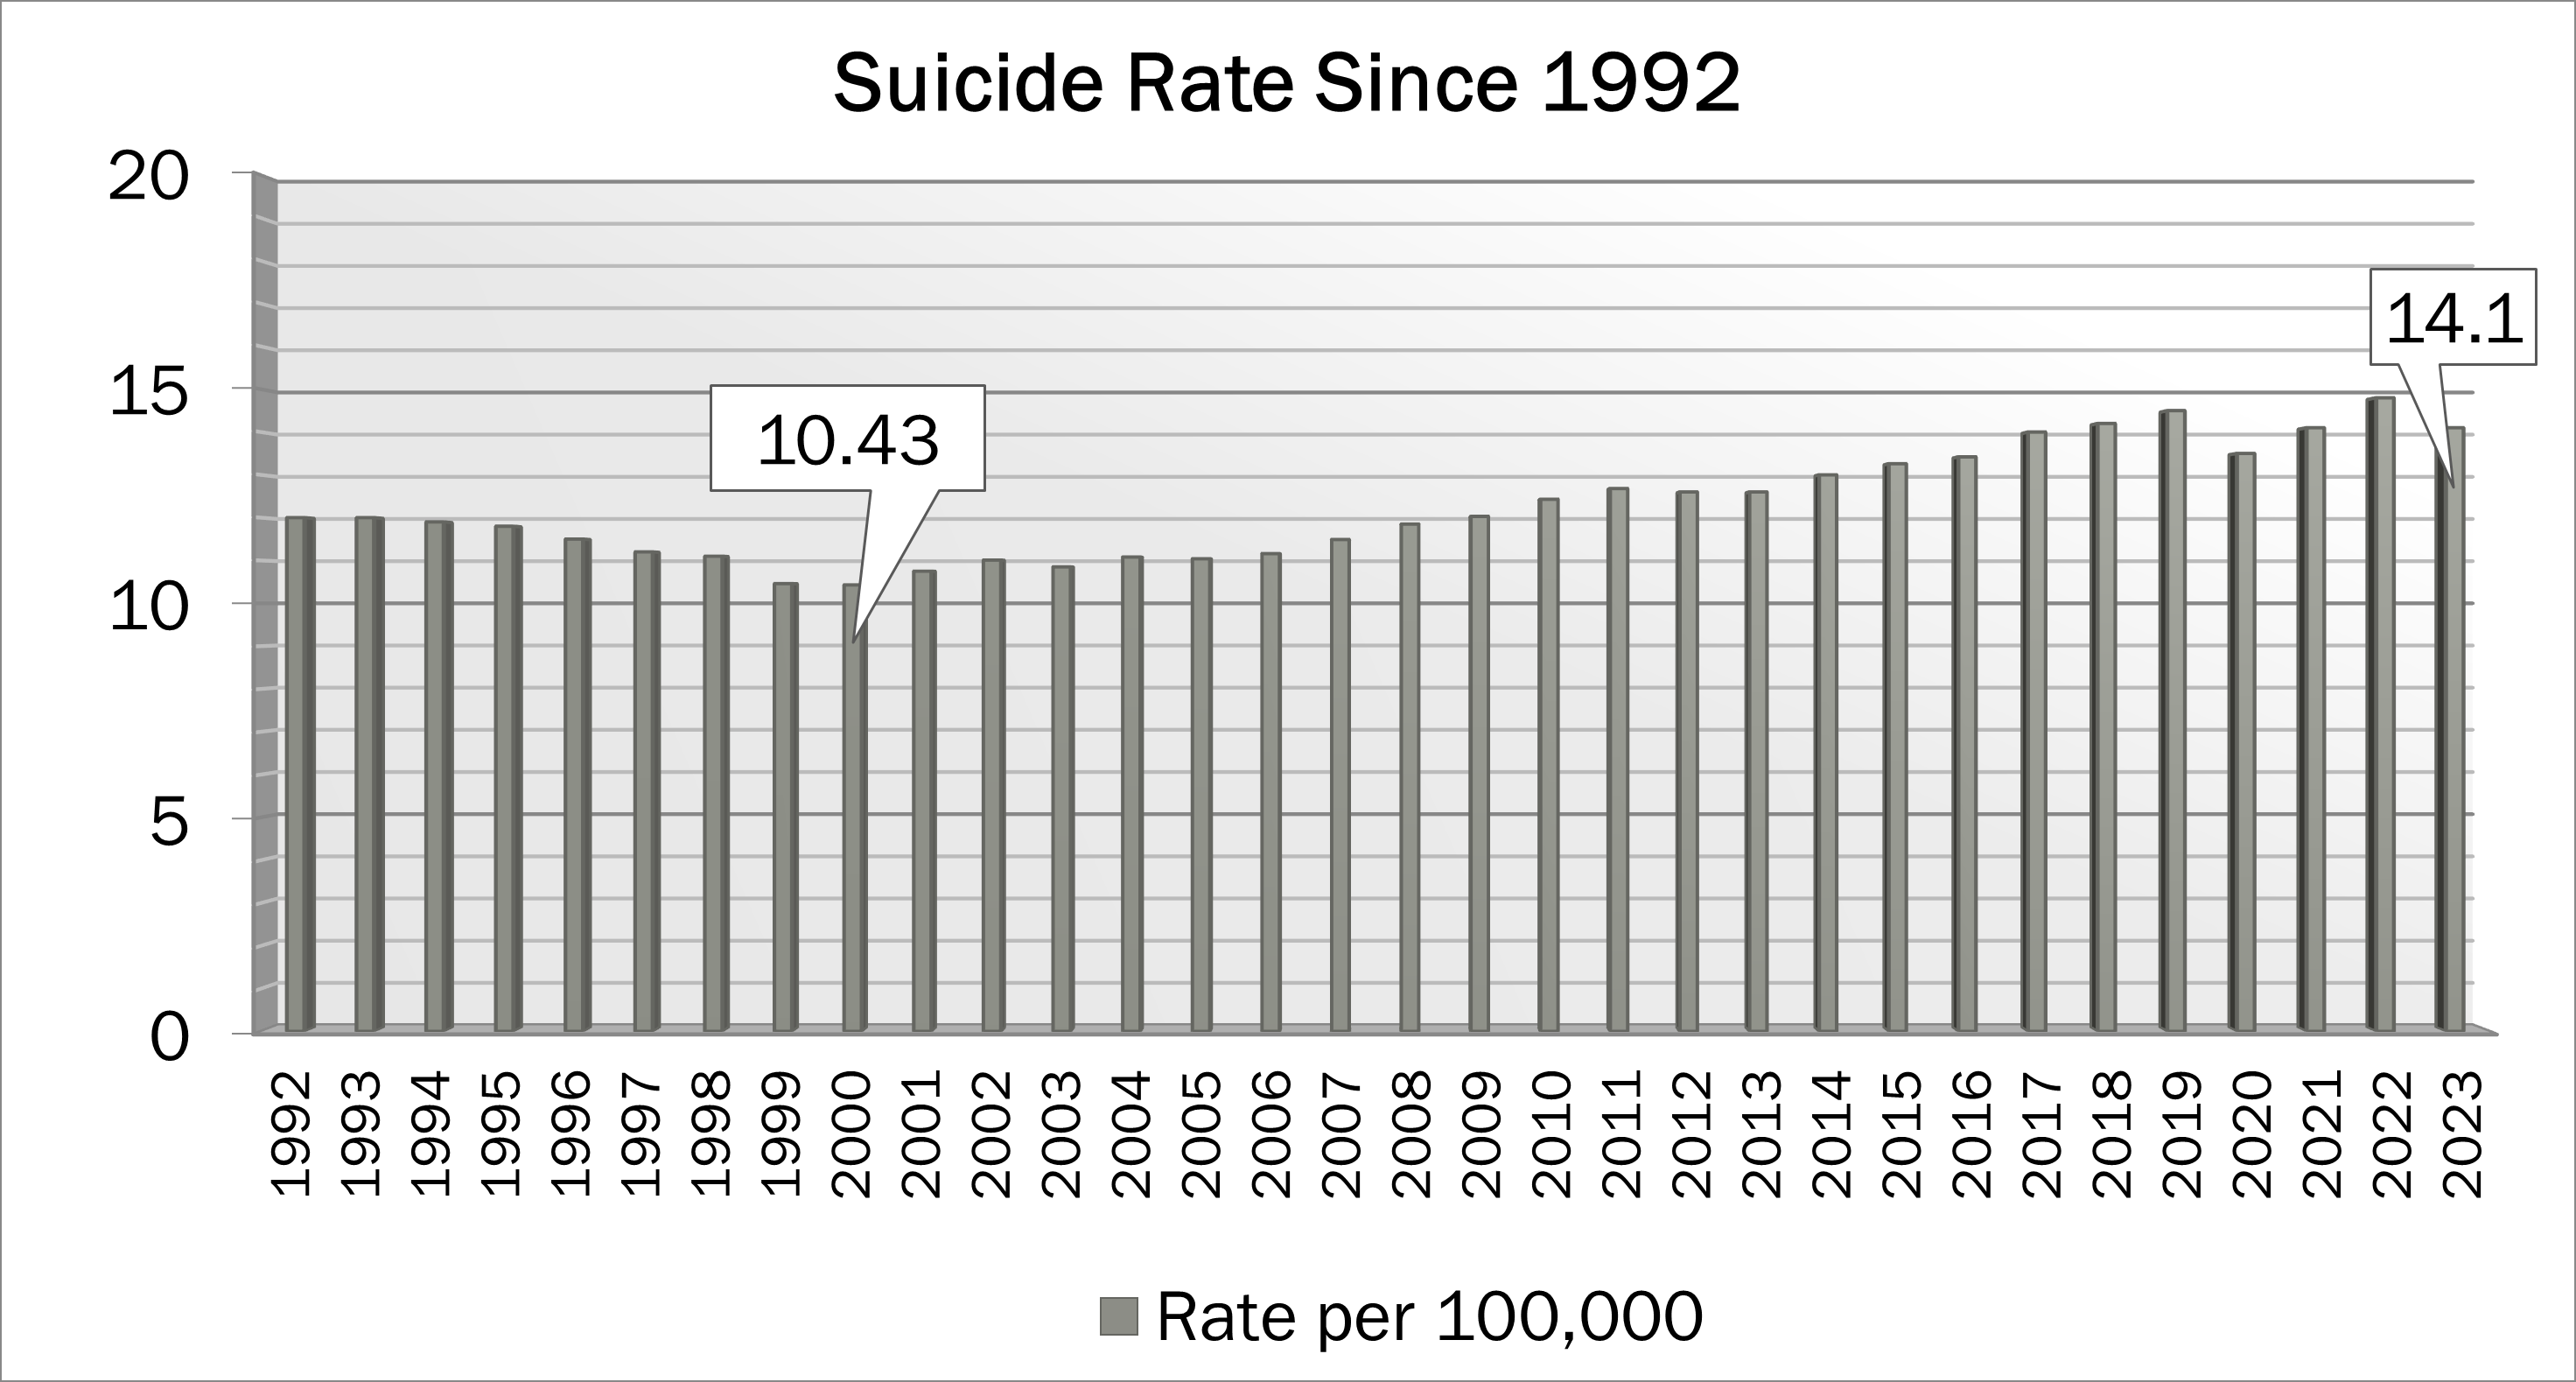
Suicide Rates Over Time
Permissions
If you want to use any of these charts, please attribute and include a link to this site.

This work is licensed under a Creative Commons Attribution 4.0 International License.