Crime Charts and Graphs
I am working on transfering all my crime charts and graphs into Tableau. You can click the icon on the Tableau graphs to see them in full screen. For all the other graphs, just click the graph to see a larger version.
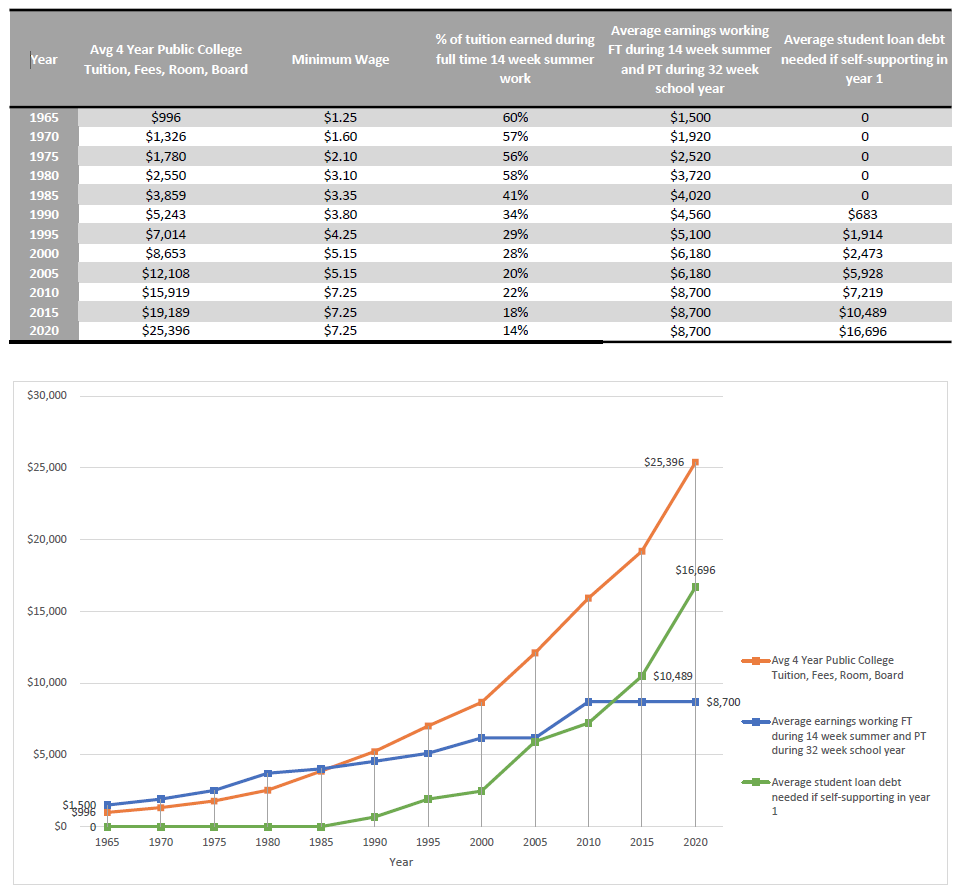
Education.
We are in the longest period in the history of the minimum wage without an increase at the federal level. If the minimum wage were raised to $15/hour, it would substantially improve the ability of young people to pay for college without having to take out student loans. In the 1960s, students could easily work full time during summers and part time during the school year and earn enough to pay for college, with some extra money left over. Today, college students working the same amount of time would only be able to earn enough to cover about half of their tuition. While wages have stagnated, tuition has increased on average by over 60% in the past 10 years.
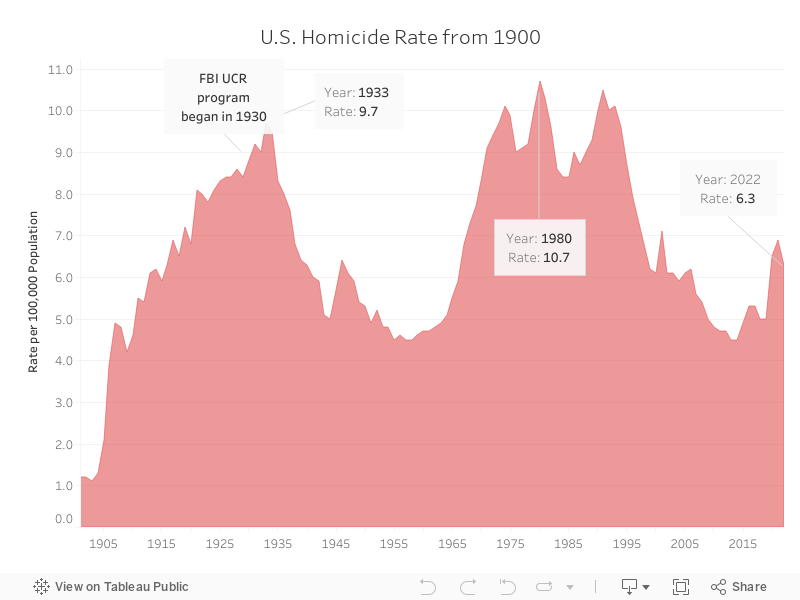
Homicide.
The overall homicide rate in the United States has fluctuated, but is currently much lower than in the 80s and 90s.
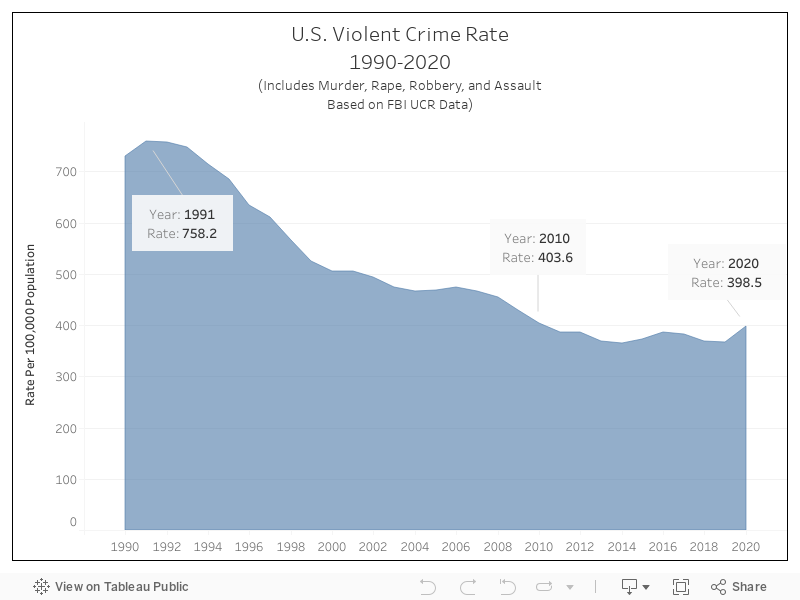
Violence.
FBI Violent Crime Rates 1996 - 2023.
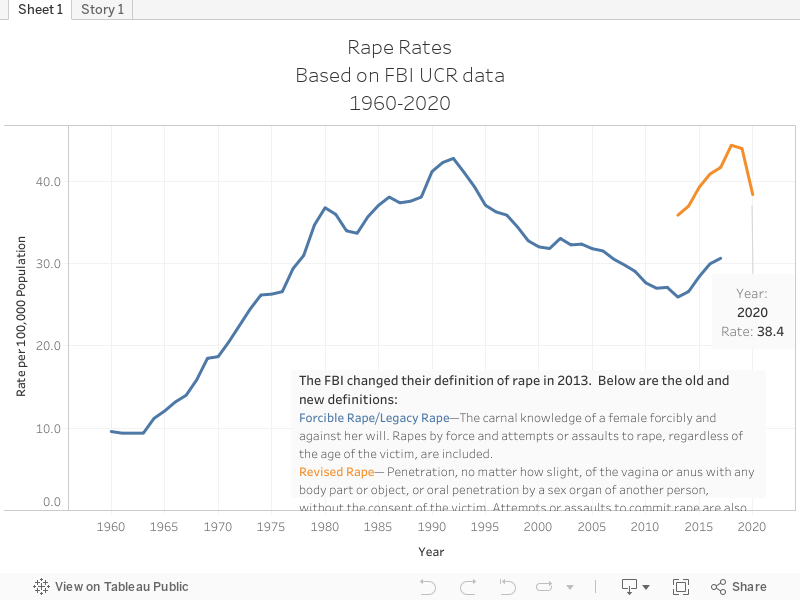
Rape Rates
In 2013 the UCR changed the definition of rape. Please see comments in the graph for more information.
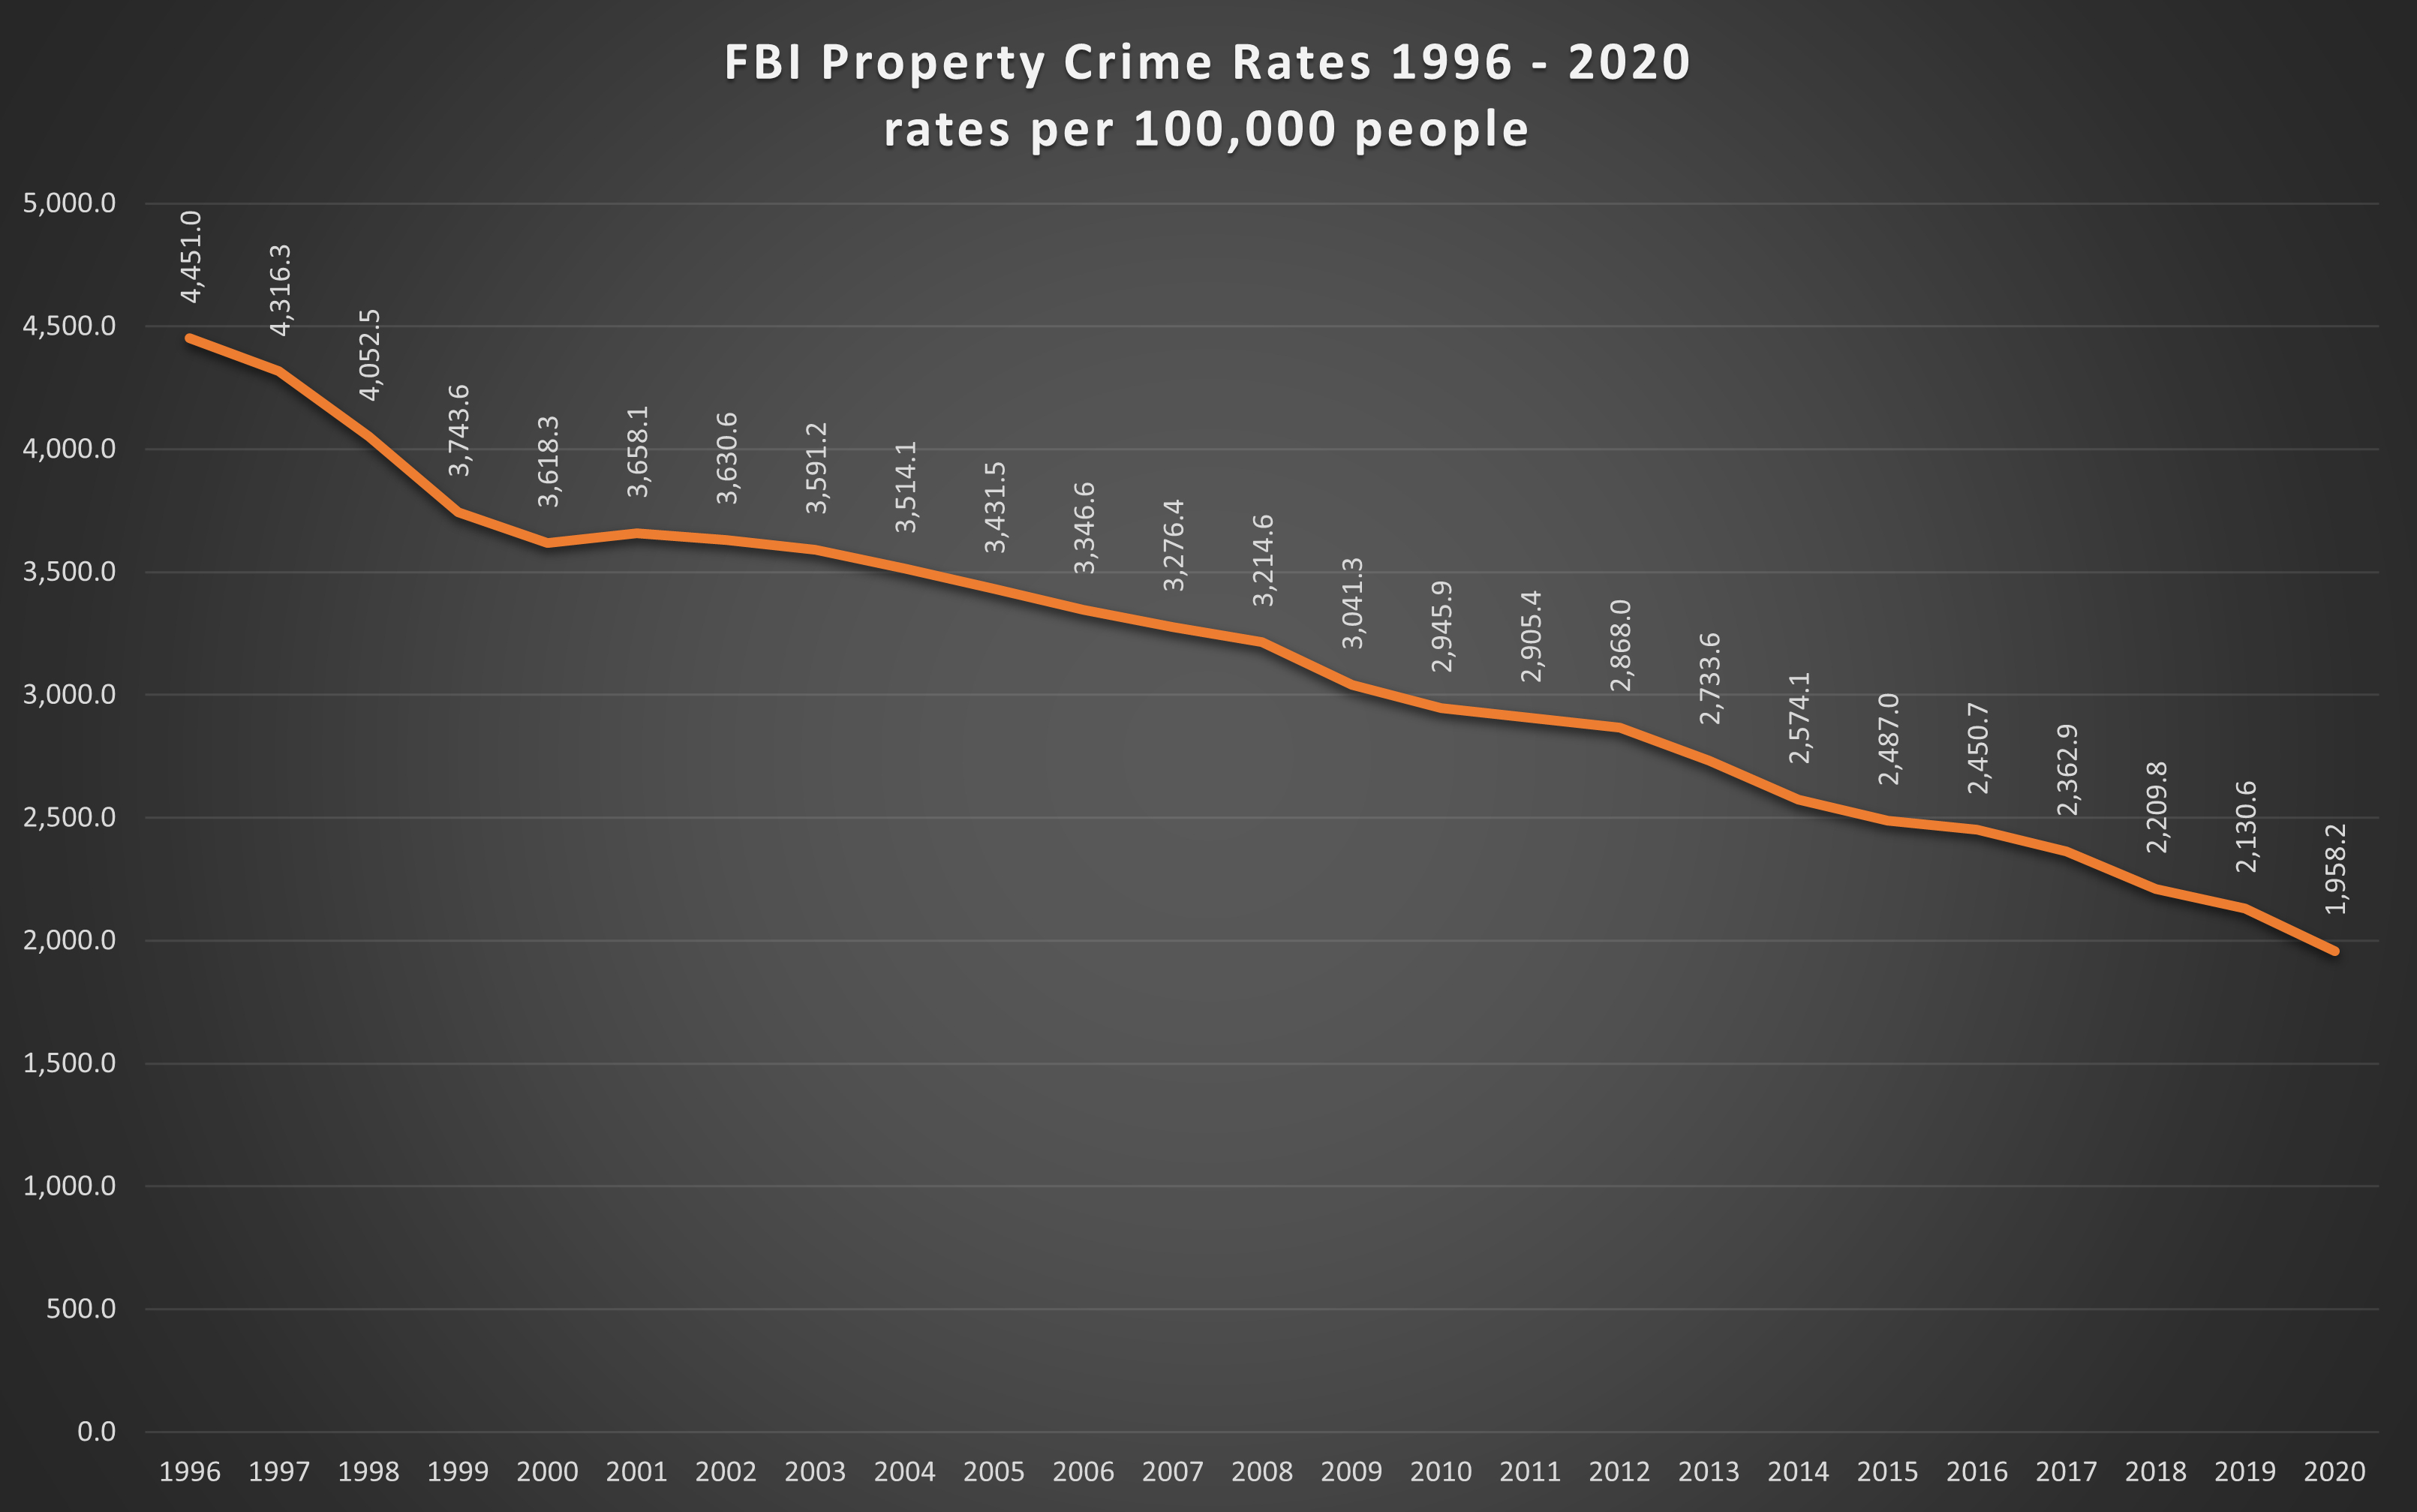
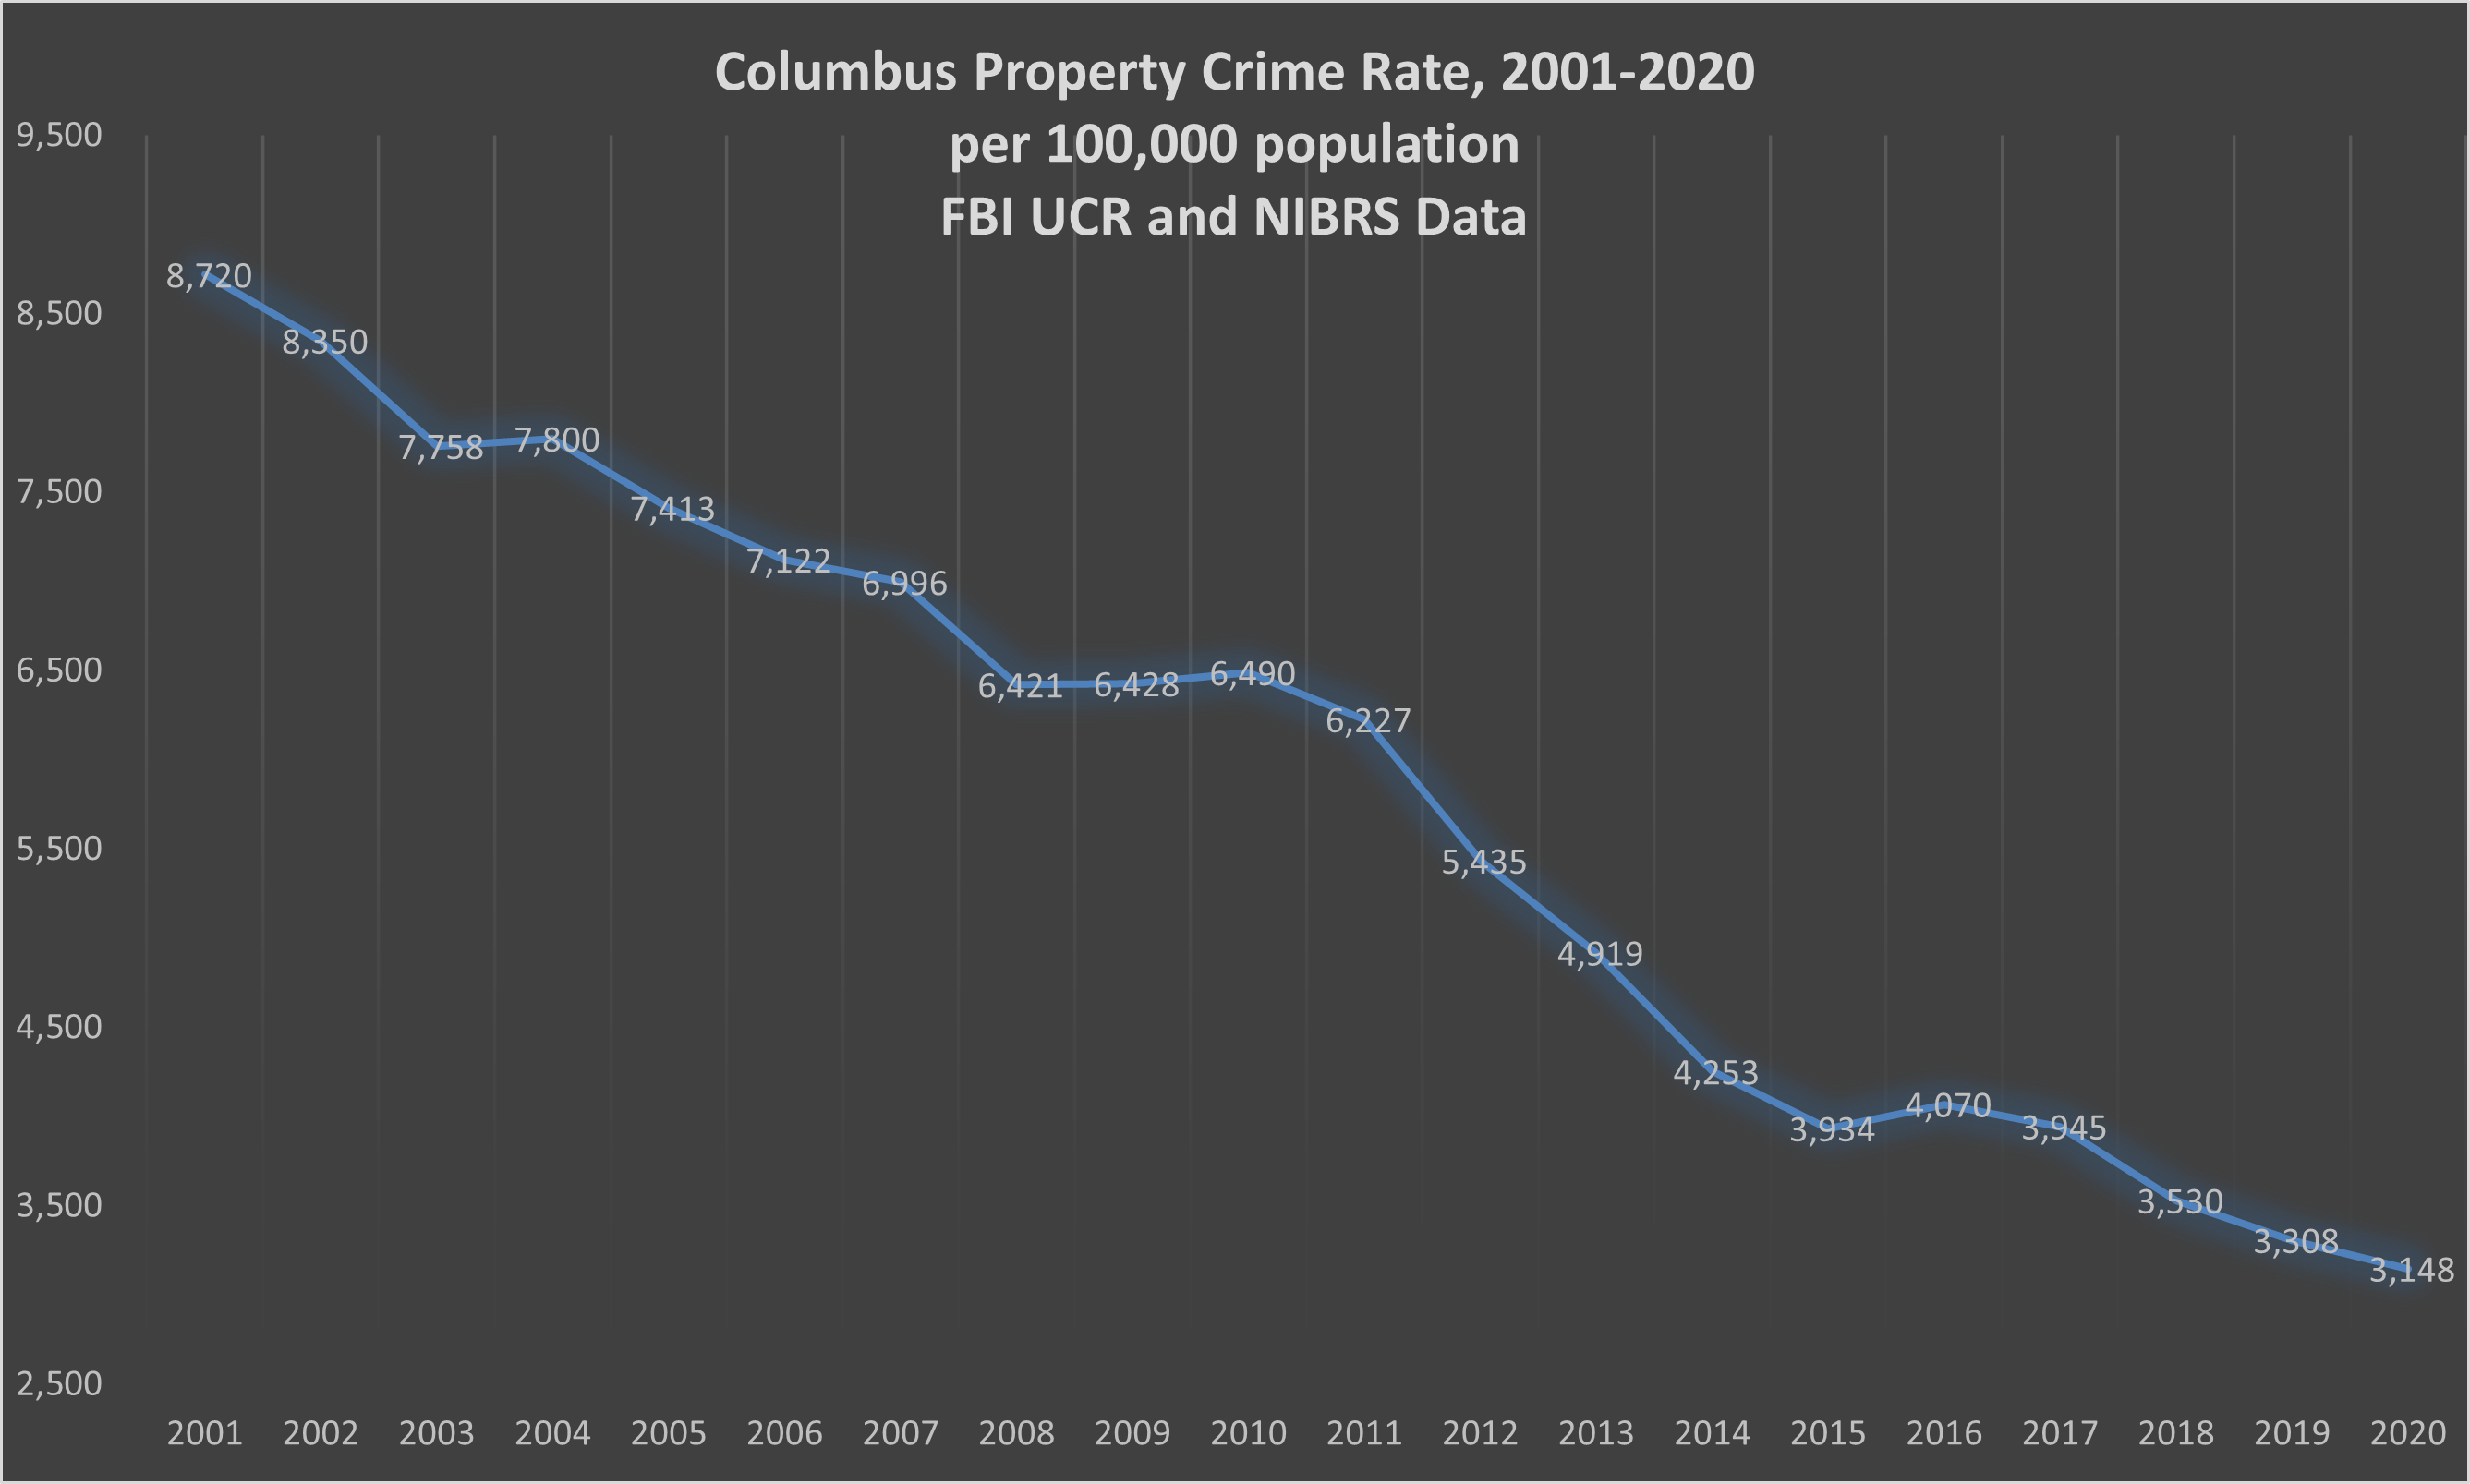
Property Crime
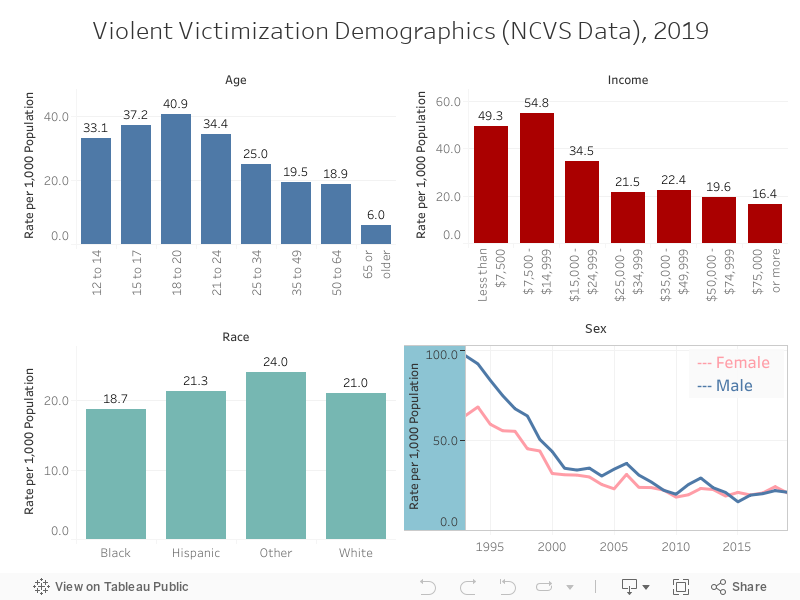
Victimization
In general, victims match the demographics of offenders. Crime victims tend to be young and poor. Victimization rates for men and women are nearly equal. Minorities are over-represented as victims.
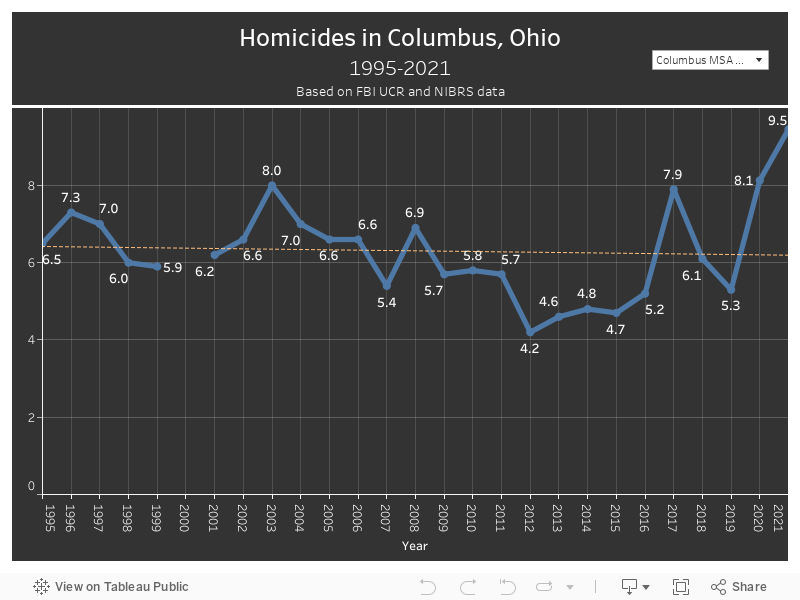
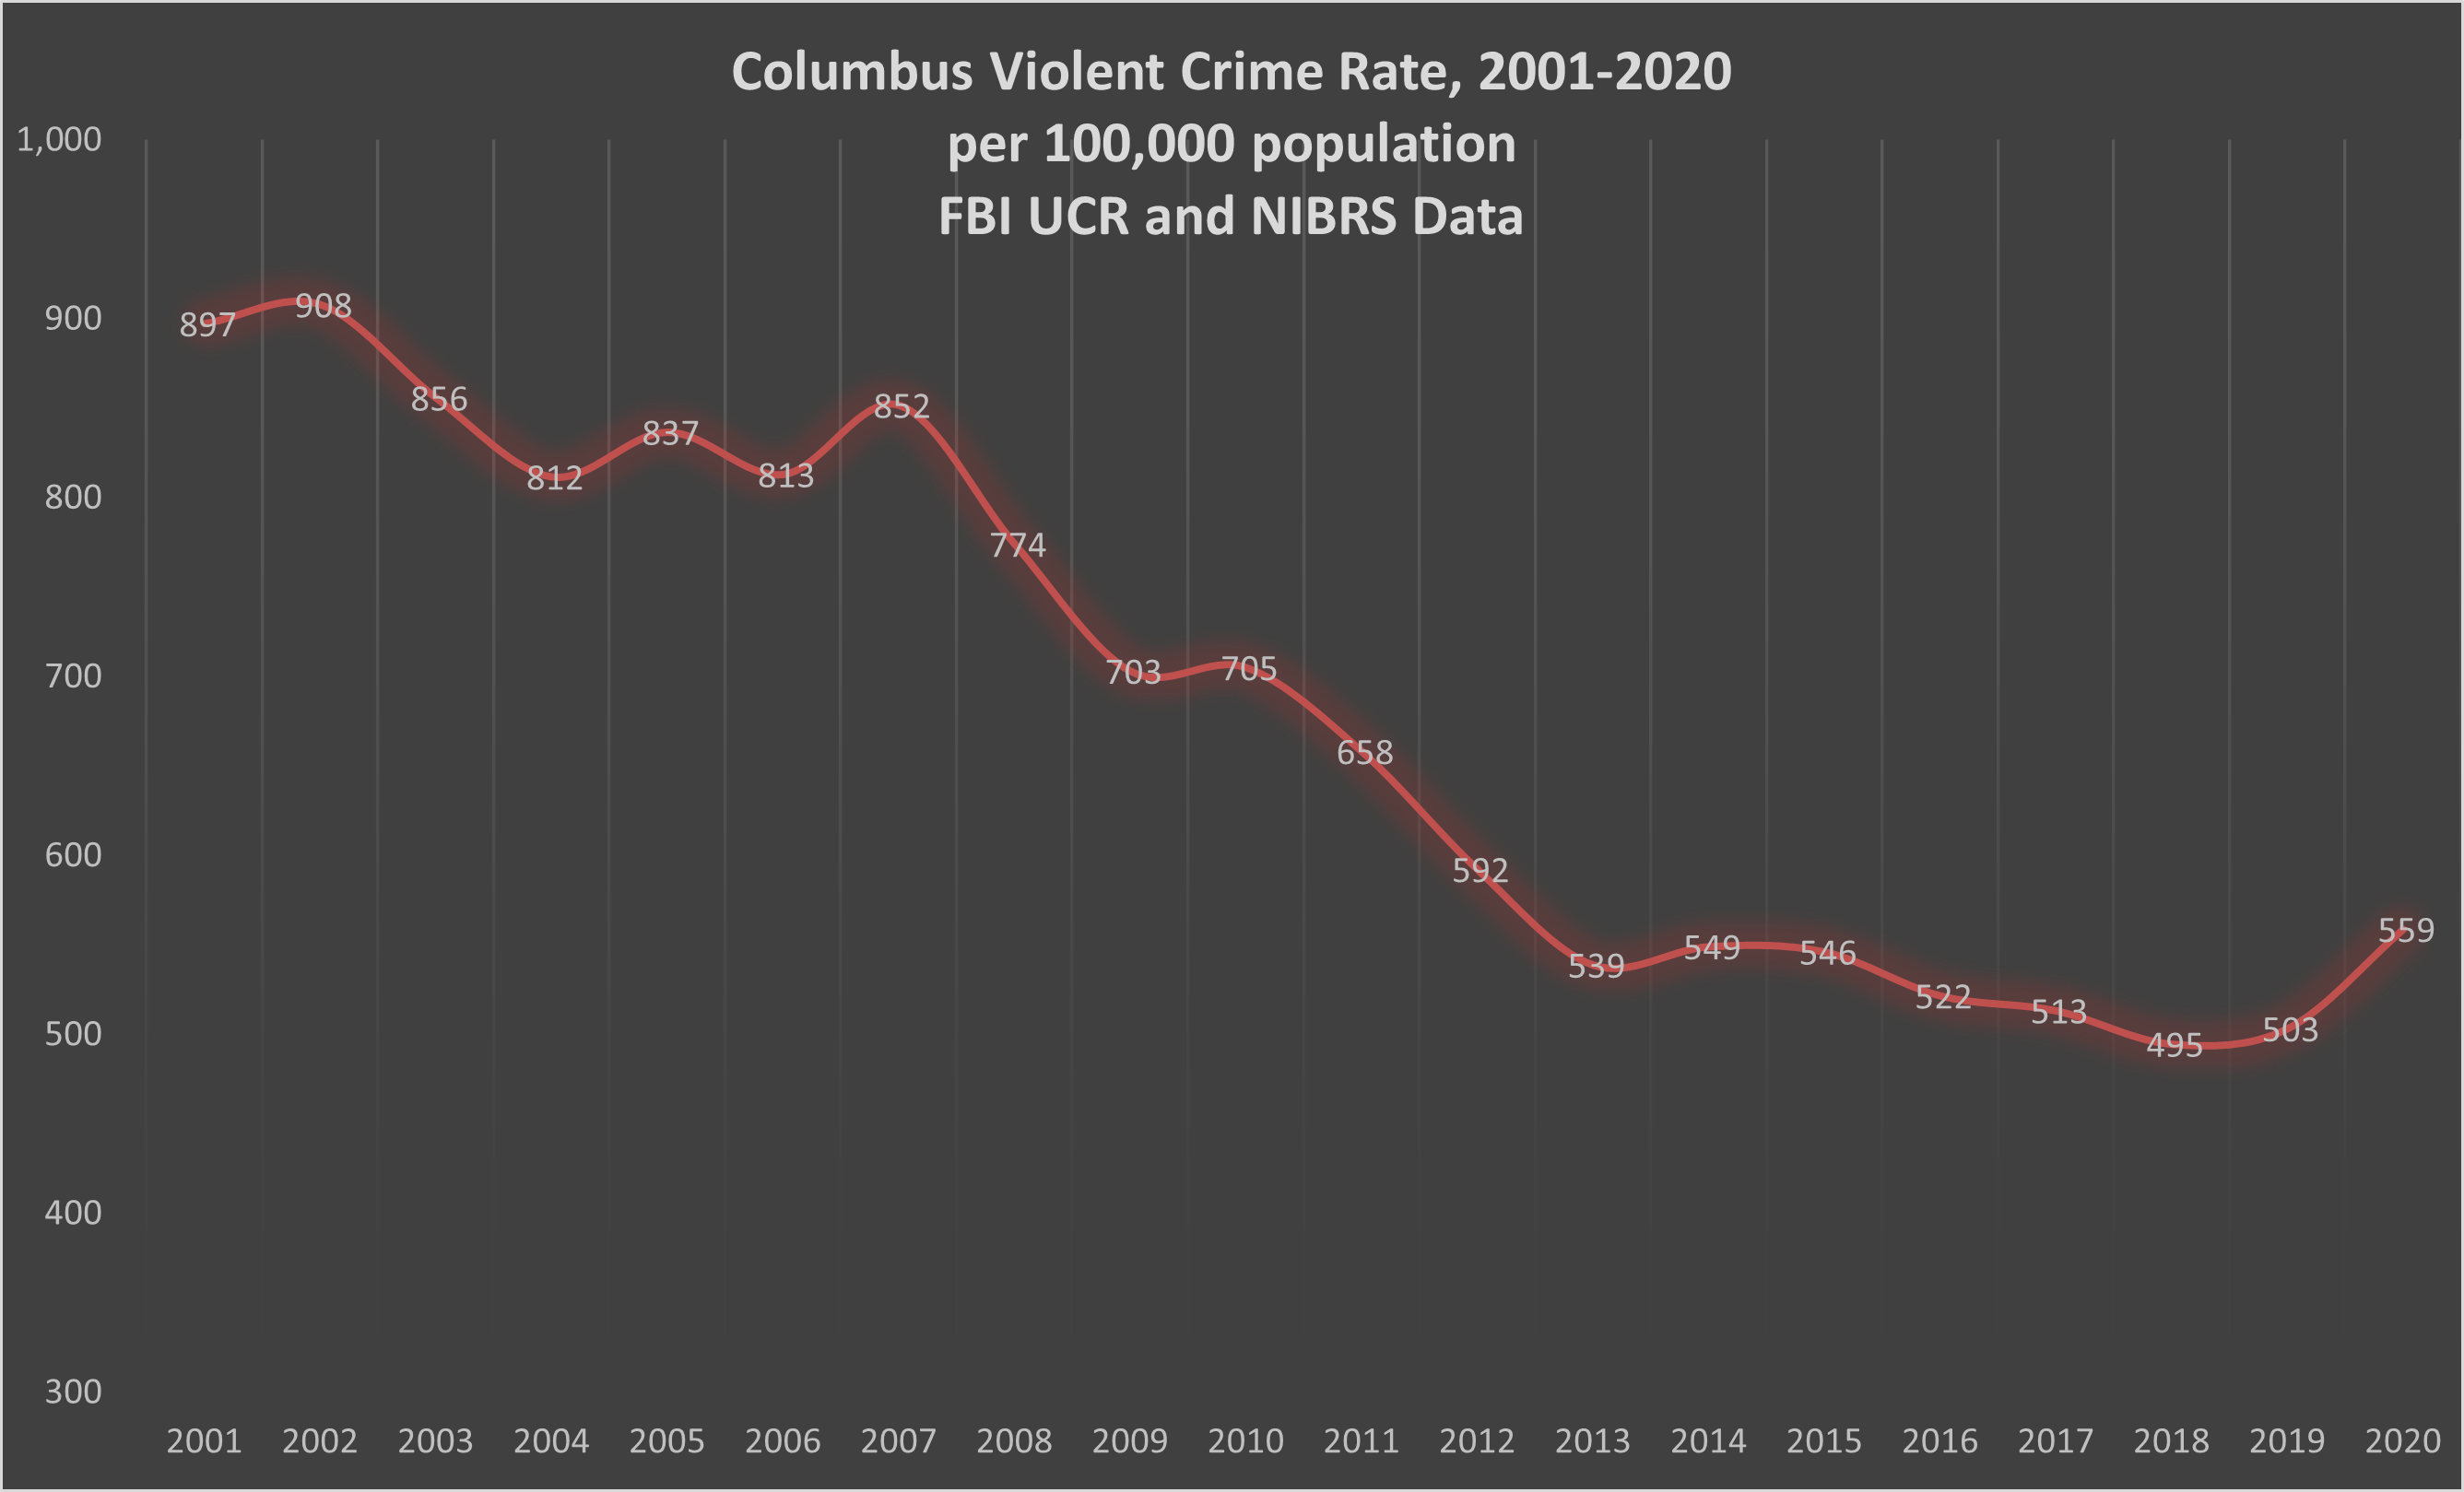
Columbus, Ohio Crime
Crime in Columbus, like in most cities is down overall. There was a sharp increase in homicide and a slight increase in violent crime in 2020. In this chart, we see an increase in total homicides over the past 20 years along with fairly significant population growth. The homicide rate in Columbus has decreased slightly for the city and for the entire MSA.
Other Crime Related Charts
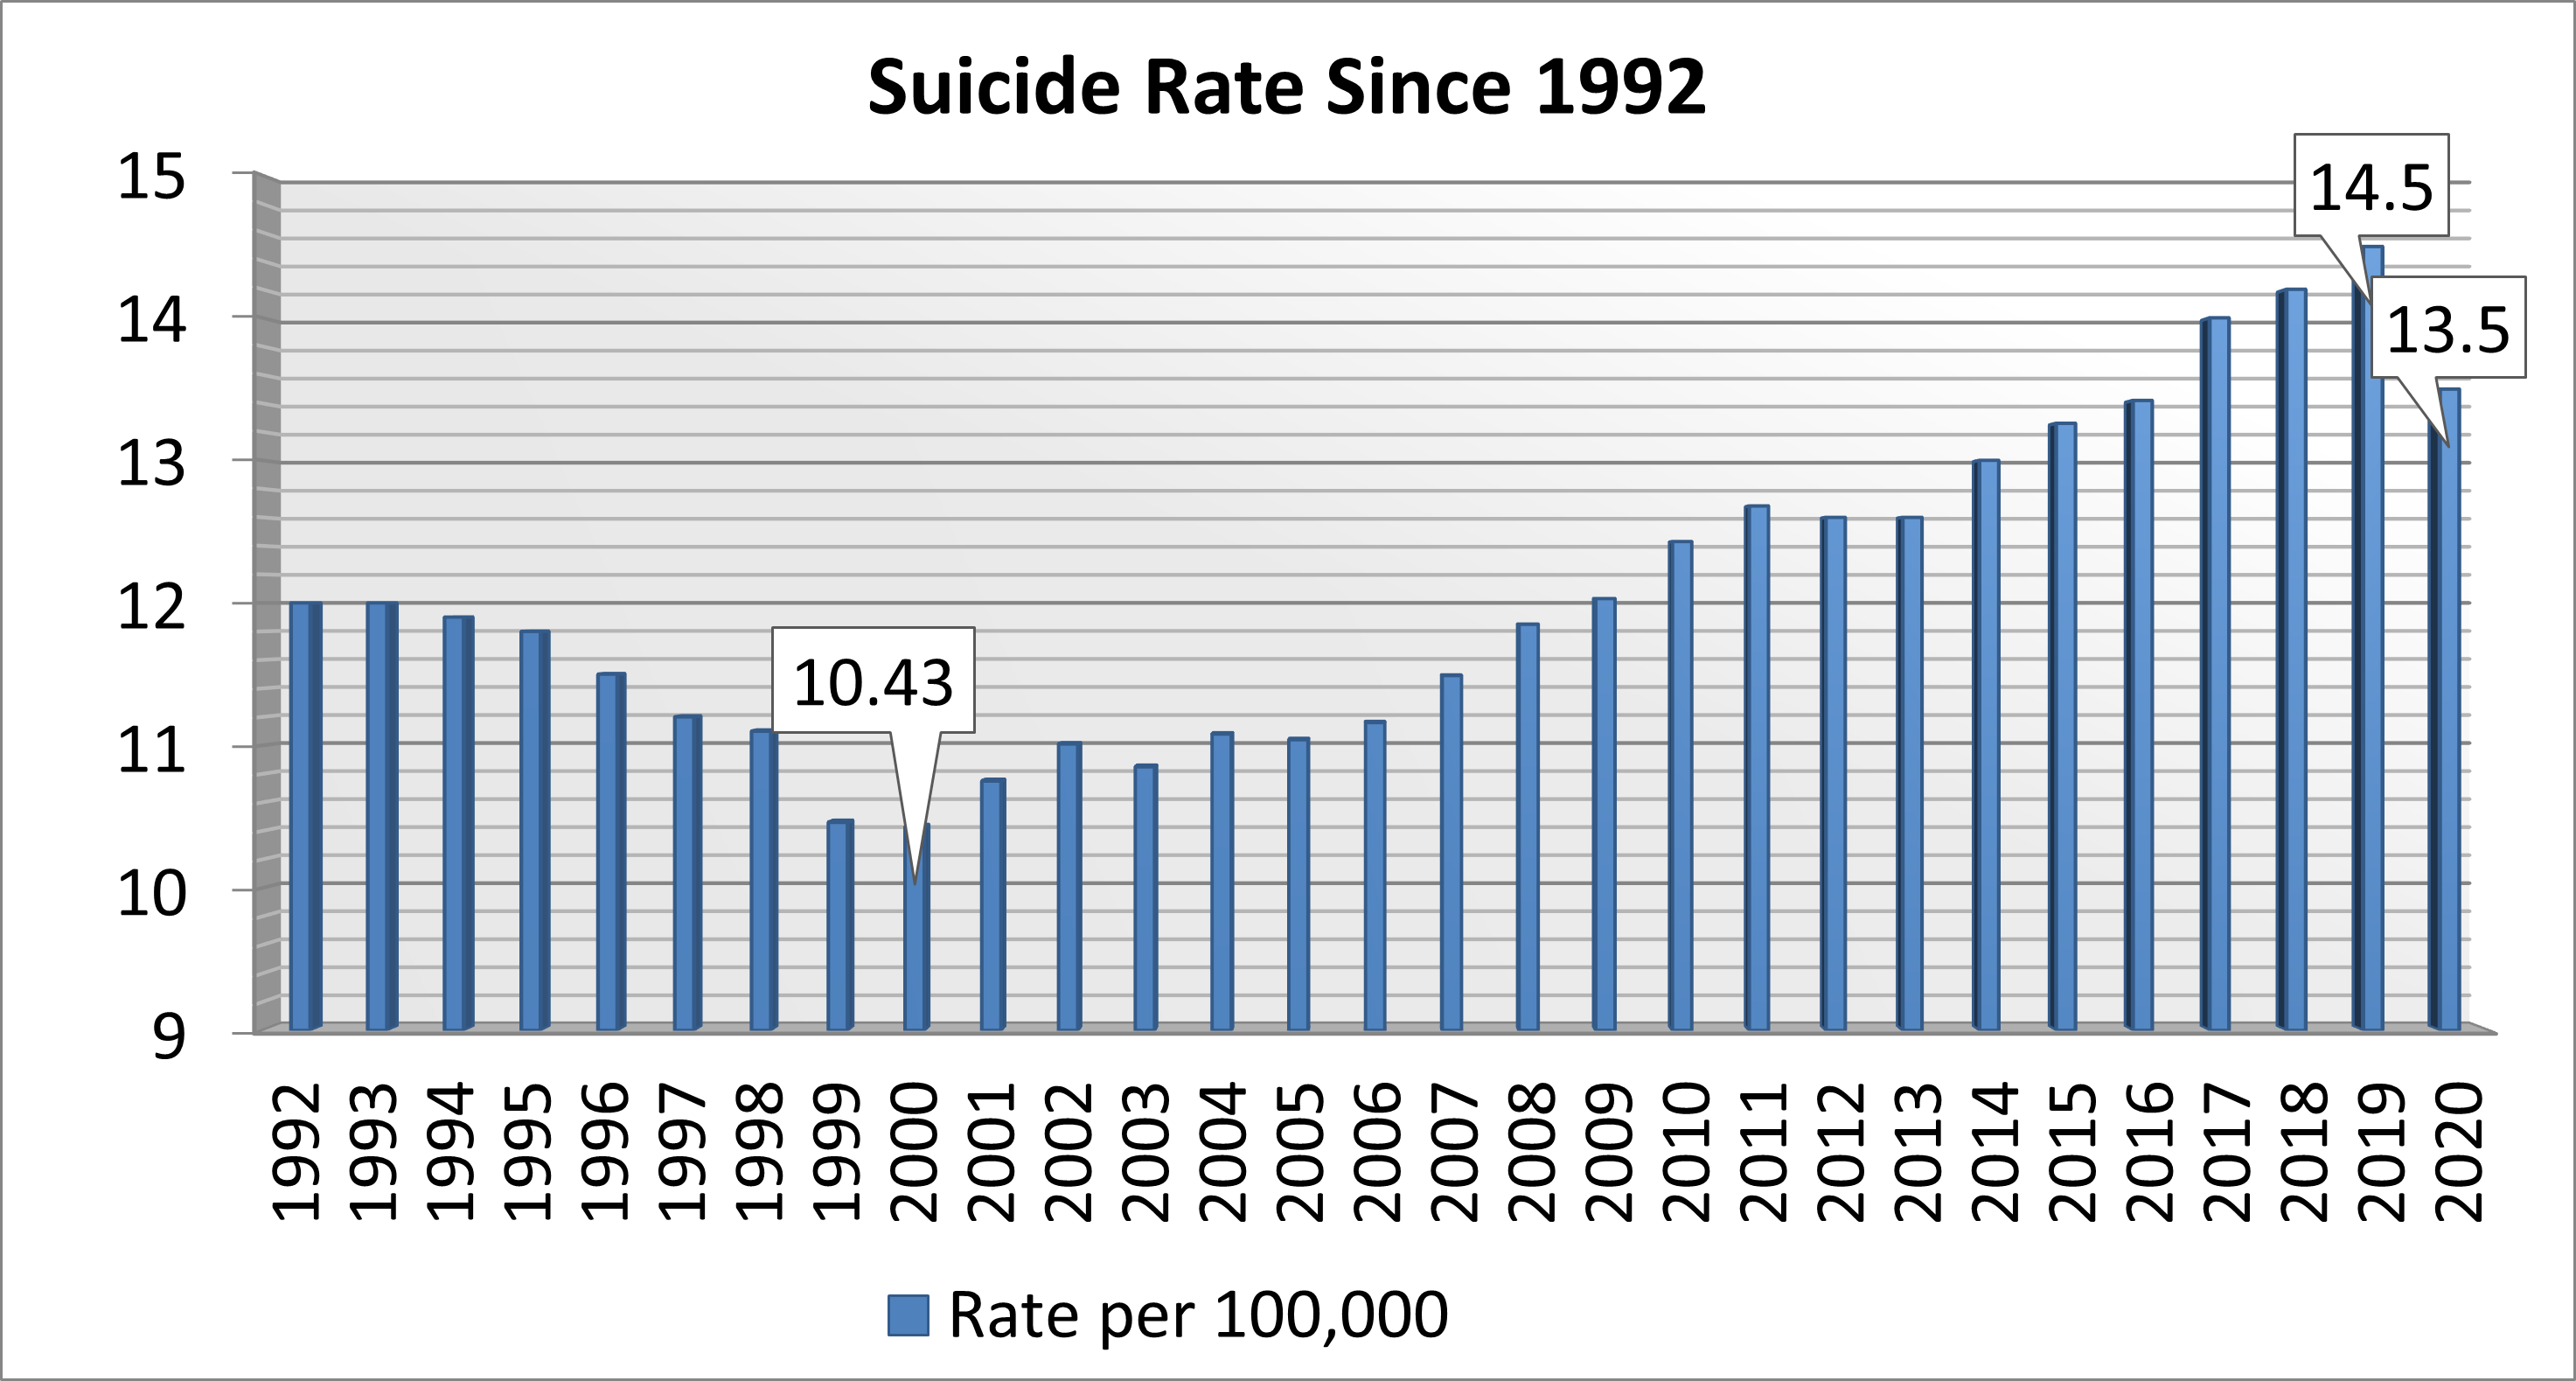
Suicide rates in the U.S. have been increasing.
Permissions.
If you want to use any of these charts, please attribute and include a link to this site.

This work is licensed under a Creative Commons Attribution 4.0 International License
Powered by w3.css